


TradeVSA - Stock Trade Ideas
Jaks Resources Berhad: Completed Pullback with High Volume

TradeVSA Weekly Chart
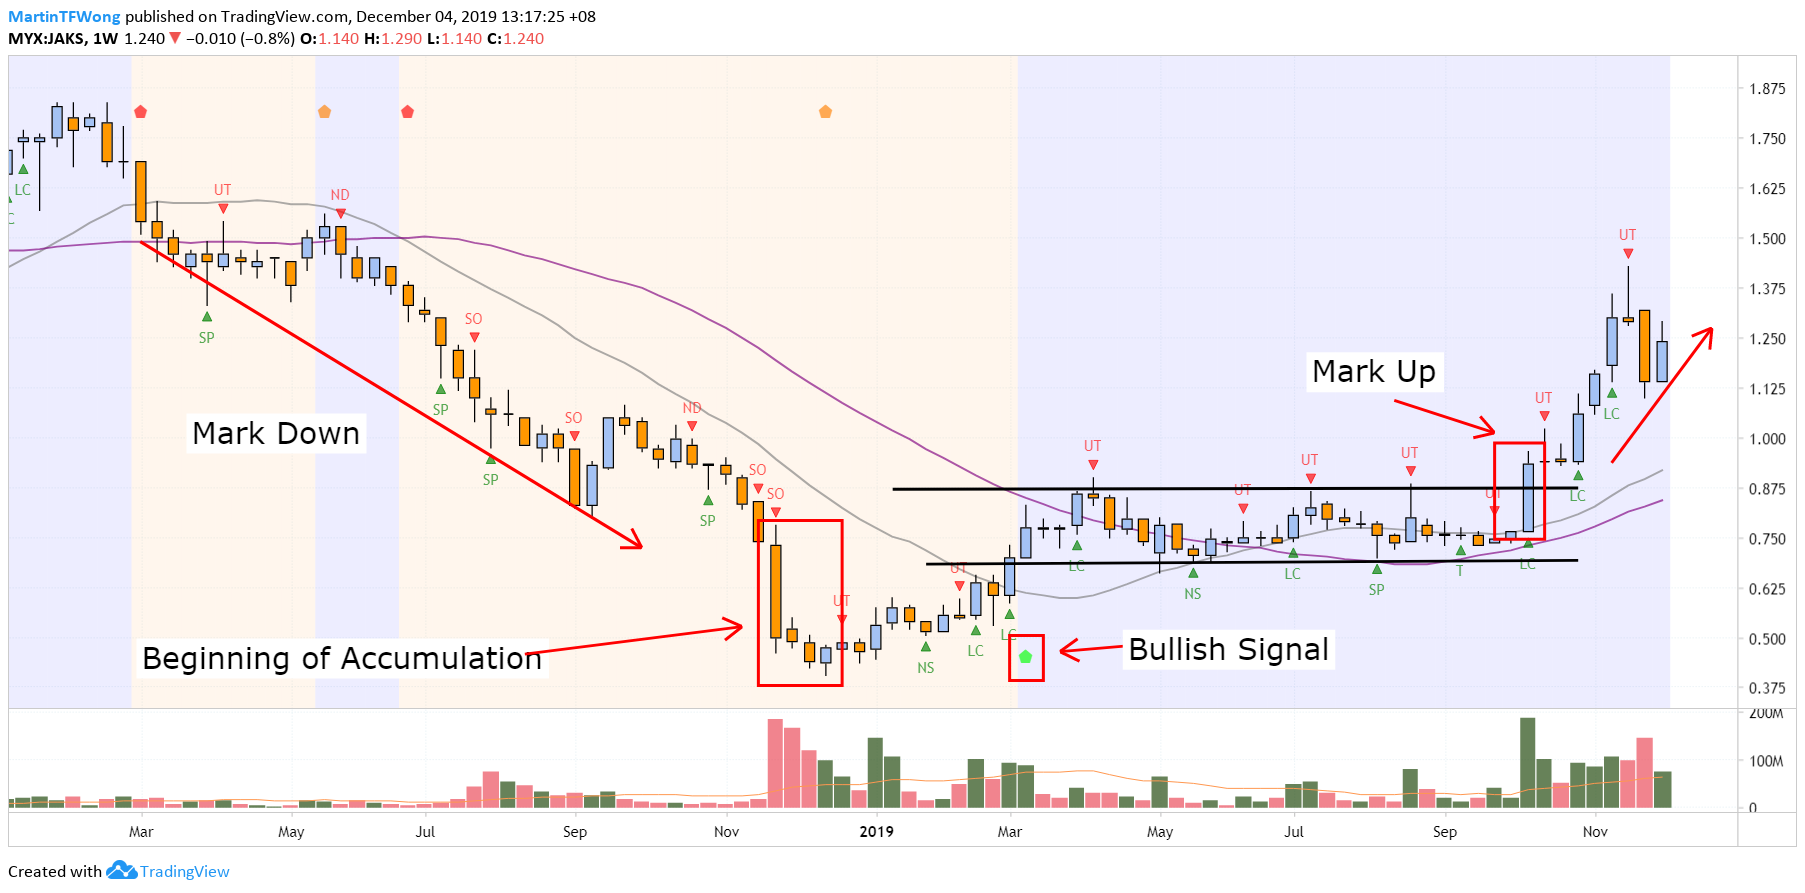
Strength in the chart:
- High volume sell-off bar shows potential accumulation at the bottom of mark-down stage
- Changed in trend to accumulation stage with green pentagon bullish signal
- Trend changed again to mark-up with Line Change high volume
- The latest UT bar show distribution and forming a pullback pattern now
TradeVSA Daily Chart
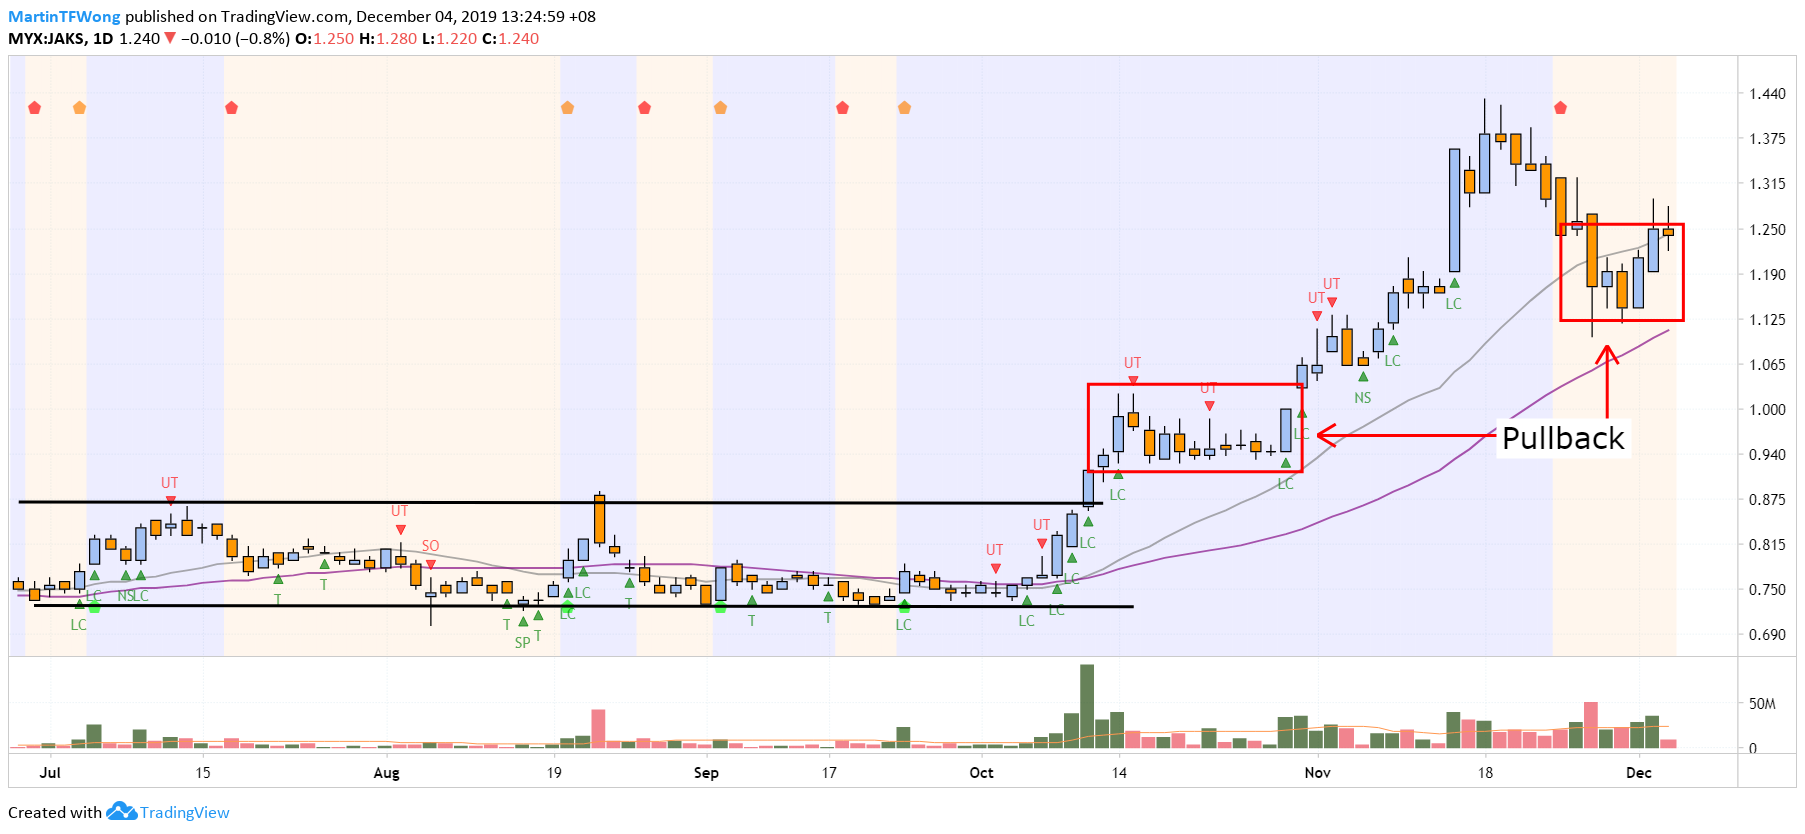
Strength in the chart:
- 1st Pullback completed after accumulation stage
- Lots of major Sign of Strength with less sign of weakness
- Forming another pullback with red pentagon bearish signal
TradeVSA Hourly Chart:
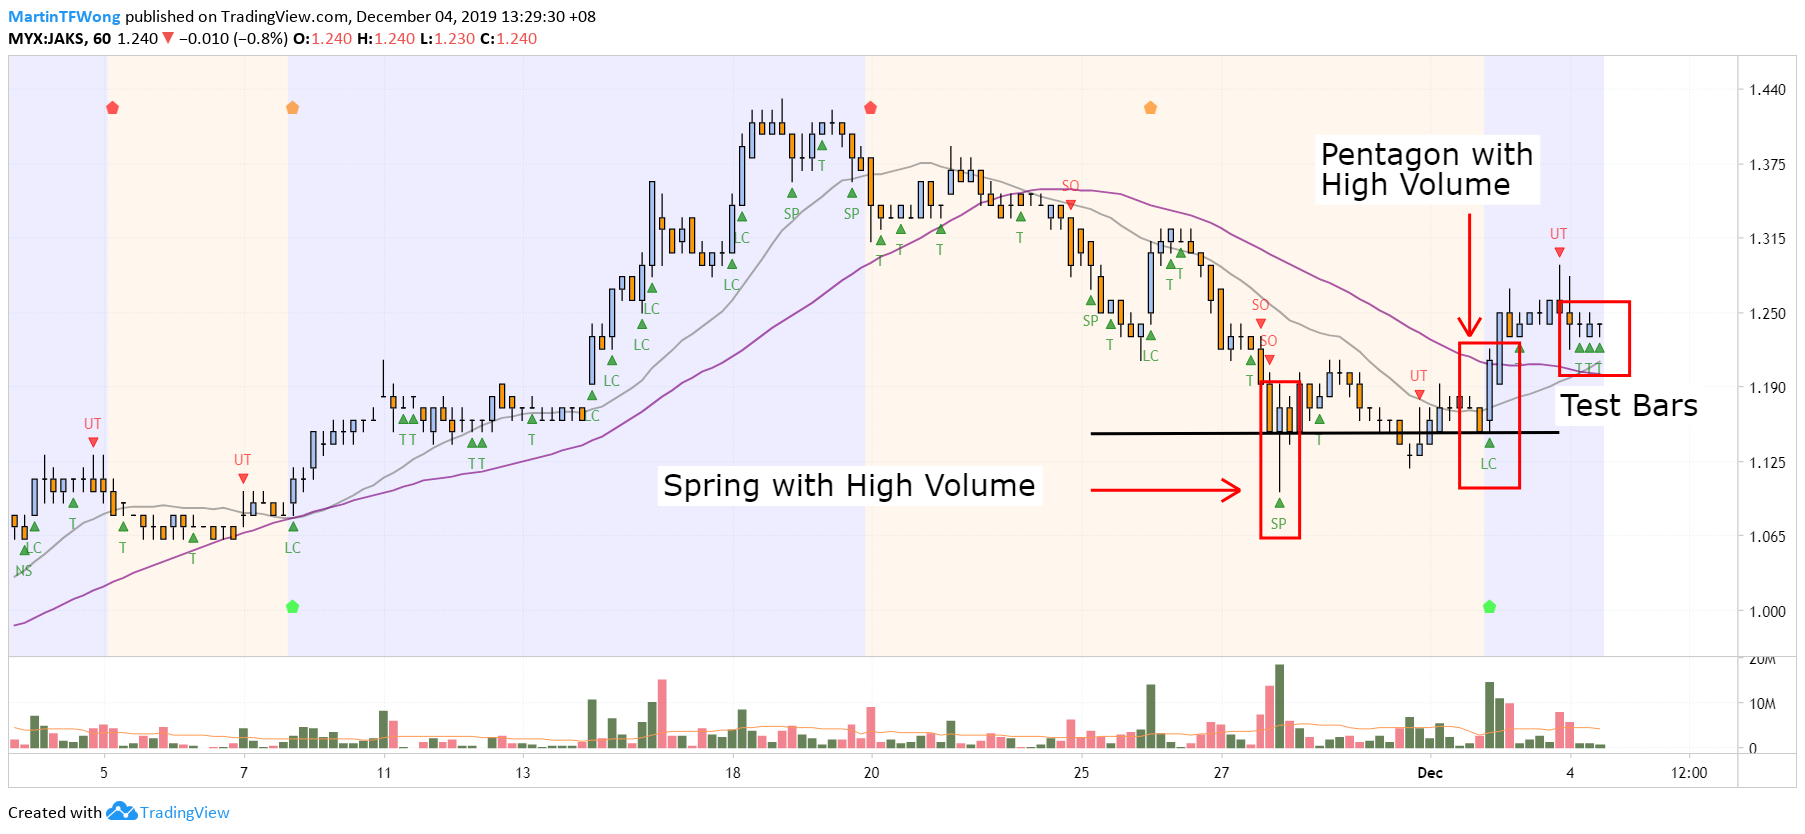
Strength in the chart:
- Spring become major support
- Line Change + Green Pentagon with high volume confirmed the strength in hourly chart
- Testing the support with 3 Test Bars
Watch the video below for more details about Jaks using Volume Spread Analysis:
- 2 December 2019
https://www.tradingview.com/chart/JAKS/8C3WufYz-TradeVSA-Pullback-completed-in-Jaks/
- 4 December 2019
https://www.tradingview.com/chart/JAKS/4zAQSvZ4-TradeVSA-Jaks-Testing-Support-in-Hourly-Chart/
Contact us via: email at support@tradevsa.com or Call/WhatsApp at +6010 266 9761 if you have any queries.
Join our FREE Education via Telegram Channel: https://t.me/tradevsatradingideas
Facebook: facebook.com/MartinTFWong
More articles on TradeVSA - Stock Trade Ideas
Discussions
Be the first to like this. Showing 0 of 0 comments
Post a Comment
Featured Posts
New Update. Discover investment communities that resonate with your ideas

Apps


Top Articles
1
https://dividendguy67.blogspot.com
3
4
Good Articles to Share
Could Kamala Harris beat Donald Trump in November's presidential race?
5
Good Articles to Share
6
Good Articles to Share
Iranian warship capsizes during repairs in port of Bandar Abbas
7
Good Articles to Share
Why Impossible Foods signed hot dog-eating legend Joey Chestnut #yahoofinance #youtubeshorts
8
Good Articles to Share
Jonathan Turley unveils exciting new book 'Free Speech in the Age of Rage'
#
Stock
Score
Daily Stocks
Stock Name
Last
Change
Volume
Stock Name
Last
Change
Volume
Stock Name
Last
Change
Volume
MQ Trading Signals
Stock
Time
Signal
Duration
No trading signals available.
Stock
Time
Signal
Duration
No trading signals available.
Featured Advertisers / Partners


Ride The Bull Short The Bear
CS Tan
4.9 / 5.0
This book is the result of the author's many years of experience and observation throughout his 26 years in the stockbroking industry. It was written for general public to learn to invest based on facts and not on fantasies or hearsay....