


ATFX Trader Magazine
US Stock Indices - US Markets Storm Higher, Is This a Trend Reversal?
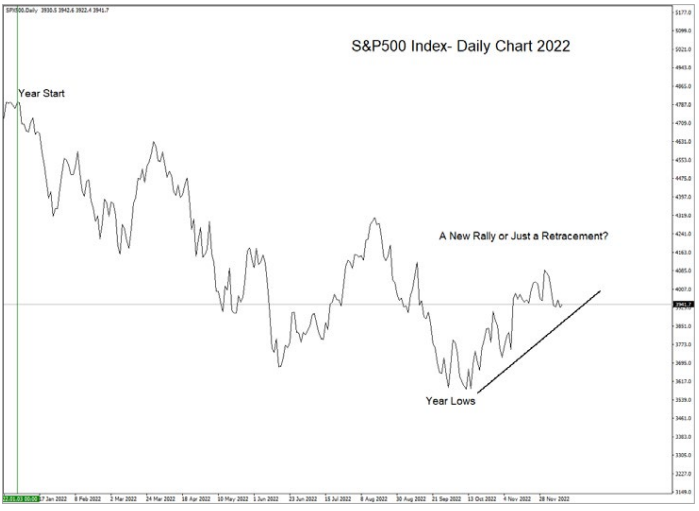
In the past few months, stock markets have staged a massive comeback recouping some of their yearly losses, driven by optimism that inflation has peaked and started cooling. The recent loosening of China’s strict zero-covid policy has also helped fuel the bullish investor sentiment. However, investors should not get overly excited as the rally could be a minor retracement to the upside before another significant drop. The cautious approach is based on an analysis of the leading US economic indicators, most of which point to a recession next year. While other metrics, such as company valuations and earnings, remain optimistic, they do not reflect the increasingly weak macroeconomic conditions.
After a challenging year, equity markets recovered more than half of their yearly losses after the August US consumer price index (CPI) data showed a substantial drop in inflation. Softer inflation numbers signalled to most traders the beginning of the end of the Fed’s battle against inflation. The US central bank started hiking interest rates aggressively earlier this year to tackle the soaring inflation, which rose to a record 9%. Adding to the bullish sentiment, signs that China is preparing to reopen its wounded economy sparked a fierce rally in risk assets.
Unfortunately, even though the S&P 500 index rose more than 15% from its April lows, all of this could be premature. Inflation is still running at almost four times the Fed’s 2% target, so it’s too early to be entirely optimistic since a peak in inflation is one thing – but how fast it goes down is an entirely different story. The factors pushing inflation lower are equally crucial in ensuring inflation falls.
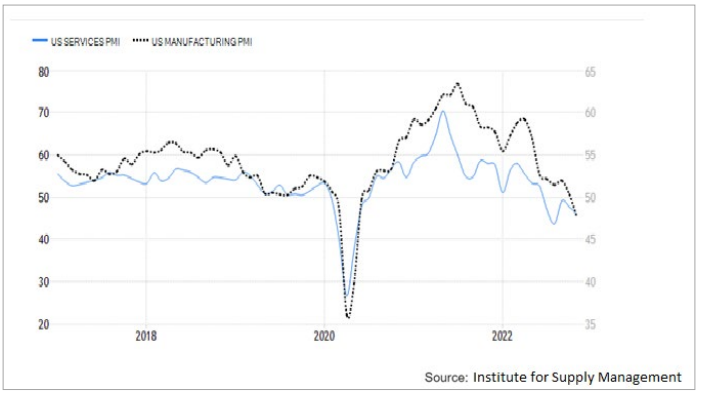
Based on current US economic indicators, inflation declined in the 3rd quarter because price pressures are settling down as demand collapses quickly, according to the business surveys such as the composite manufacturing and services PMI. The PMI readings warn that the US economy is headed straight for recession as higher borrowing costs and the cost-ofliving affect consumers’ spending power, affecting the economic cycle.
It’s not only business surveys that are warning of a recession. Other economic indicators suggest the same too. Inventory levels, housing prices and consumer confidence warn of an upcoming recession. Inventories are incredibly high, which is a classic sign of a downturn. Housing prices have fallen off a cliff as home sales are down dramatically this year, which is unsurprising considering that mortgage rates have exceeded 7% for the first time in two decades, discouraging borrowing. Consumer confidence metrics are similarly alarming, and people are unlikely to make major spending decisions if they feel unsure about the future.
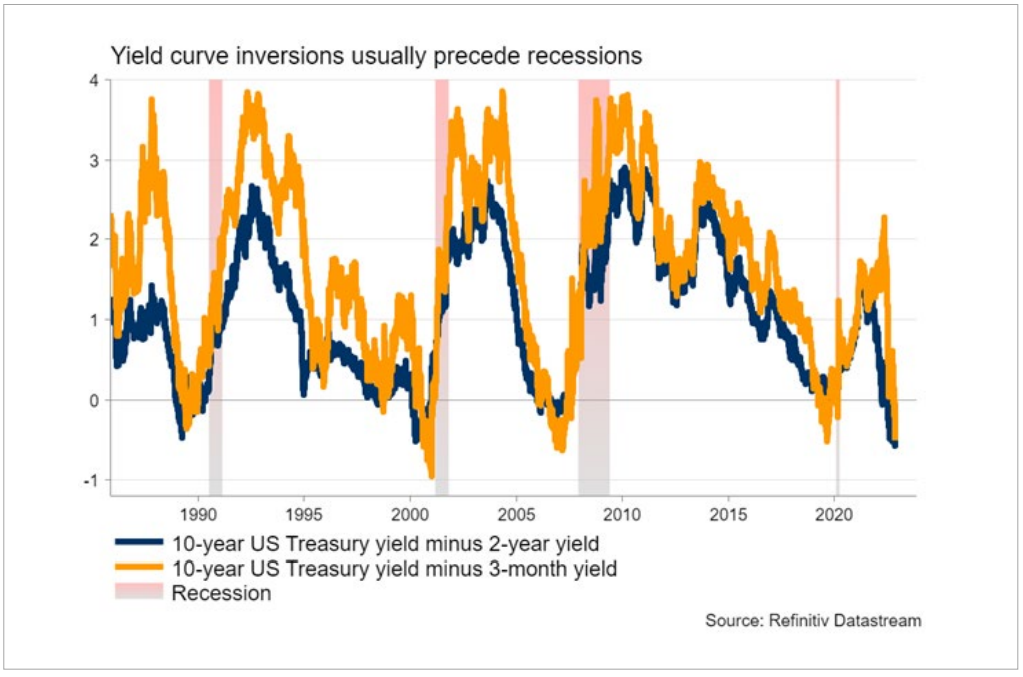
Finally, if you look at the Fed’s favorite recession indicator, the treasury yield curve, it’s warning of deep trouble ahead as it is deeply inverted. The 3-month Treasury yields are trading far above 10-year yields, indicating that bond traders are betting that the economy is about to hit a wall. The inverted yield curve has predicted recessions with terrifying accuracy in the past.
With economic indicators pointing to a recession, the economic problems within the Equities markets are:
1. Valuations are way too expensive.
2. Earnings do not reflect the weakening economy yet.
Therefore, even though the latest stock market rally could keep going, it could be a short-term rally purely driven by speculation and short-term trading. Hence, it is likely to run out of steam before long.
Let’s start with the valuation aspect. Historically over the last decade, an era characterized by very low interest rates, whenever there was a selloff in the equity markets, the forward earnings multiple was closer to 14x, given that low interest rates boost valuations. At the time of writing, the S&P500 is trading at 16.5x forward earnings, while the federal reserve has hiked interest rates to 4.50% and intends to raise it to 5% next year. In other words, if a drop-off is coming, given today’s high interest rate regime, the stock markets could bottom at a much lower multiple. This rationale provides ample scope for further downside based on a valuation perspective before considering earnings declines.
As for company earnings, estimates continue to be overly optimistic and out of sync with what the economic indicators suggest about the economy. However, as the global economy enters a slight recession, these estimates are expected to be revised lower as consumer demand shrinks. S&P 500 companies that receive more than 40% of their revenue from overseas will be the hardest hit.
What about the technical perspective?
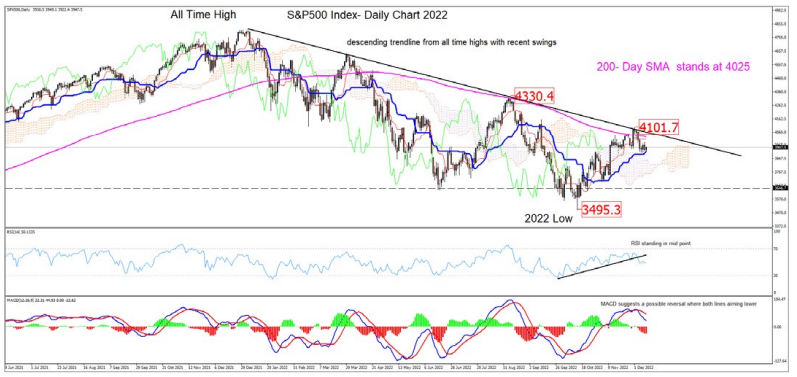
The S&P500 index is trading near the 4,000 level as a 5-day correction pushed it below the 4,100 high seen on December 1, 2022. The correction is a product of the 200 SMA playing its role as a robust dynamic resistance level. The index could not defeat the moving average and generated a perfect lower swing high. As you can see in the chart below, there is a descending trendline from the all-time highs, with the recent swing highs confirming the bearish bias. However, the Ichimoku Kinko Hyo indicator justified the recent upside move when prices moved past the bearish cloud and beyond the kijun-sin line at 3,900. Nonetheless, the S&P 500 retreated from recent highs, and now the RSI is pointing south while at the midpoint. Furthermore, the MACD confirmed a possible price reversal to the downside, with both lines threatening to break below 0 mid-line.
The stochastic indicator also supports the above correction as it finally broke below its moving average and moved away from overbought territory. The almost vertical move lower supports the view that this correction might have some legs. Only the RSI is challenging this bearish development as, despite the recent drop, it remains above 50, thus giving some hope to the bulls that the battle has not been lost yet.
If the bears take the reins, the immediate targets would be 3,820, represented by the Ichimoku clouds. The next critical level would be at the 3,846 support level, where the downside rally ended in late June and again in late October. If the bears are determined, they will target the crucial yearly low of 3,495.
Should the bulls take control of the market and break the 200 SMA at 4,100, the path to retest the August high of 4,330 would be wide open.
All told, the latest rallies do not herald the beginning of a new bullish market. By every metric, a recession seems inevitable. And when it is accompanied by very high interest rates, traders will start asking, “How long and how deep will the recession be?”
Therefore, if a recession is coming, is there a bright side? This will depend on how the Federal Reserve will act in the upcoming quarters. If the Fed and the government are keen on causing a recession to squash inflation, they could also turn the ship around before it sinks completely.
Make no mistake, the latest financial debacles, such as famous Crypto exchanges imploding and UK pension funds facing collateral hurdles, are simply the first signs of what happens when liquidity gets drained from the markets due to higher interest rates.
By Mohammed Shanti, ATFX Senior Market Analyst (MENA)
More articles on ATFX Trader Magazine
Crude Oil - Will Crude Oil Rally Despite Market Worries About an Economic Recession?
Created by newsroom | Jan 17, 2023
Gold & Silver - A Recession May Boost Prices Amid Rate Hike Pressure
Created by newsroom | Jan 17, 2023
USDCAD - The BoC Could Provoke Economic, Oil Price and CAD Price Shocks
Created by newsroom | Jan 17, 2023
European Stock Indices - How Will Euro Stocks Perform vs Monetary Tightening and a Recession?
Created by newsroom | Jan 17, 2023
Discussions
Be the first to like this. Showing 0 of 0 comments
Post a Comment
Featured Posts


Latest Videos


.png)


Apps


Top Articles
1
Stock Pick Contest Year 2024
2
https://dividendguy67.blogspot.com
3
Koon Yew Yin's Blog
5
6
7
BFM Podcast
8
Stock Market Enthusiast
CIMB: Uptrend Continues - Is the Best Yet to Come? (Uptrend + Bullish) - KingKKK
#
Stock
Score
Daily Stocks
Stock Name
Last
Change
Volume
Stock Name
Last
Change
Volume
Stock Name
Last
Change
Volume
MQ Trading Signals
Stock
Time
Signal
Duration
No trading signals available.
Stock
Time
Signal
Duration
No trading signals available.
Featured Advertisers / Partners


Ride The Bull Short The Bear
CS Tan
4.9 / 5.0
This book is the result of the author's many years of experience and observation throughout his 26 years in the stockbroking industry. It was written for general public to learn to invest based on facts and not on fantasies or hearsay....