


Ali Invest, Ali Blog
这个基金是投资界的神话,有赚冇赔!

如果你有买基金或自己下场买股票。都知道股市不是风风平浪静的地方。
上次Ali分析本地的投资信托基金Unit Trust,Ali坦坦荡荡批评基金,有弹有赞,得到欢迎。
 这次说说(ASNB) Amanah Saham Nasional Berhad 旗下的基金。这是一家后台雄厚的公司政府国民投资公司(PNB) 。目前旗下共12项基金。就先简单介绍一下,毕竟今天要谈这个基金有什么神奇,和解开她的面纱。
他们的表现回报又如何,一起看看:
6项固定基金
-->
| ASNB | Fixed Price | |||||
| Symbol | ASB | ASW 2020 | ASM | ASD | AS1M | ASB2 |
| Fund Name | Amanah Saham Bumiputera | Amanah Saham Wawasan 2020 | Amanah Saham Malaysia | Amanah Saham Didik | Amanah Saham 1Malaysia | Amanah Saham Bumiputera 2 |
| Type | Income | Income | Income | Income | Income | Income |
| Category | Equity | Equity | Equity | Equity | Equity | Mixed Asset |
| Launch Date | 2 January 1990 | 28 August 1996 | 20 April 2000 | 20 April 2001 | 5 August 2009 | 2 April 2014 |
| Eligibility | Bumiputera | Malaysian | Malaysian | Bumiputera | Malaysian | Bumiputera |
| Minimum | 10 units | 100 units | 100 units | 100 units | 100 units | 10 units |
| Maximum | 200,000 units | Unlimited | Unlimited | Unlimited | Unlimited | 200,000 units |
| Fund Size | Unlimited | 24.345 b | 19.843 b | 6.575 b | 16.705 b | 10.0 b |
| Sales Charge | None | None | None | None | None | None (1) |
| Redemption Charge | None | None | None | None | None | None (1) |
| Payment of Redemption | On-the-spot | On-the-spot | On-the-spot | On-the-spot | On-the-spot | On-the-spot (1) |
| Financial Year End | 31 December | 31 August | 31 March | 30 June | 30 September | 31 March |
-->
| Divdend | ||||||
| Year | ASB | ASW 2020 | ASM | ASD | AS1M | ASB2 |
| 1990 | 14 | |||||
| 1991 | 12.5 | |||||
| 1992 | 12.5 | |||||
| 1993 | 13.5 | |||||
| 1994 | 14 | |||||
| 1995 | 13 | |||||
| 1996 | 13.25 | |||||
| 1997 | 11.5 | 10.1 | ||||
| 1998 | 10.5 | 9.8 | ||||
| 1999 | 10 | 8.2 | ||||
| 2000 | 11.75 | 8.8 | ||||
| 2001 | 10 | 7.25 | 7.8 | |||
| 2002 | 9 | 7.25 | 7 | 10 | ||
| 2003 | 9.25 | 6.6 | 6.6 | 6.8 | ||
| 2004 | 9.25 | 7 | 7 | 7 | ||
| 2005 | 9 | 7.1 | 7.2 | 7.2 | ||
| 2006 | 8.55 | 6.8 | 6.75 | 6.8 | ||
| 2007 | 9 | 8 | 6.8 | 7 | ||
| 2008 | 8.75 | 7 | 7.8 | 7 | ||
| 2009 | 8.55 | 6.3 | 6.25 | 6.3 | ||
| 2010 | 8.75 | 6.35 | 6.3 | 6.35 | 6.38 | |
| 2011 | 8.8 | 6.5 | 6.38 | 6.5 | 6.5 | |
| 2012 | 8.9 | 6.6 | 6.5 | 6.6 | 6.6 | |
| 2013 | 8.7 | 6.7 | 6.8 | 6.8 | 6.7 | |
| 2014 | 8.5 | 6.6 | 6.6 | 6.6 | 6.6 | |
| 2015 | 7.75 | 6.4 | 6.6 | 6.6 | 6.4 | 7.75 |
| 2016 | 7.25 | 6.3 | 6.3 | 6.3 | 6.1 | 7.05 |
| 2017 | 6 | 6.5 | ||||
| Average 10Y | 8.50 | 6.68 | 6.55 | 6.61 | ||
| Average 5Y | 8.05 | 6.50 | 6.38 | 6.58 | 6.45 | |
| Average 3Y | 7.83 | 6.43 | 6.30 | 6.50 | 6.37 | 7.10 |
| Cumm. 10Y | 125.45 | 91.34 | 89.16 | 90.10 | ||
| Cumm. 5Y | 48.42 | 37.14 | 36.75 | 37.52 | 36.88 | |
| Cumm. 3Y | 25.38 | 20.57 | 20.11 | 20.79 | 20.34 | 22.84 |
这些基金的特色就是价格固定,没有变动,定价为RM1每单位。他们是股票型基金,有涉及股票投资。但是他们应该是Income收入型基金。
他也会跟着经济表现,在90年代有10%以上,而近年大致上,都有6%-8%的股息。
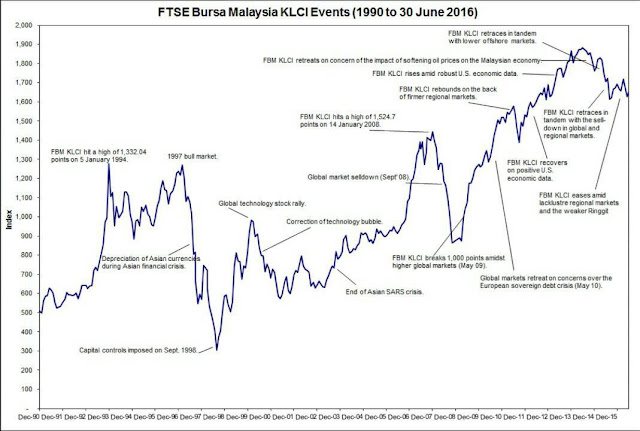
最神奇,最神奇的地方就是这么多年来,不管“晴天雨天”,天天都是好天,都能保持派息,基金价格保持RM1。看看我们的股市这二十多年来经历了大大小小的熊市,这些基金经理是如何做到的,只有赚冇赔,是不是很神奇。简直是投资界的神话,目前应该没有其他基金经理能做到。
这就是最吸引投资者的特点。
Source: http://ongmali.blogspot.my/2016/
神秘的面纱NAV
这些固定型基金ASB, ASW2020, ASM, ASD, AS1M, ASB2 的年报里,很奇怪看不到NAV净资产的真正数字。买基金第一点就是看NAV,因为全部计算都是根据NAV计算。在年报里只是看到portfolio里有多少%是股票,多少%是债卷,没有直接列出NAV数字。为什么那么神秘?Ali也不知道。
没有NAV就很难评估基金的表现,Ali想了想,研究研究,想到可以间接,反向计算,得到NAV大约的数字。利用年报里的经理人的费用,除以%NAV,就得到估计的NAV。
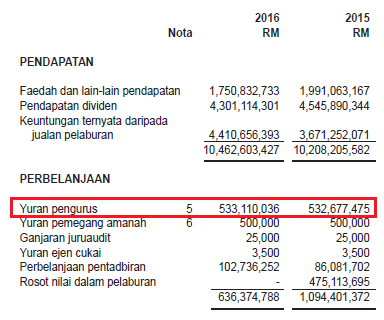
2016年,经理人费用是RM5.33亿,依据年报说是占0.35%NAV,那么NAV就是RM1523亿(发放股息前),发放股息后NAV是RM1426亿 (RM 142,665,121,303)。(这是估计数字,不是真正数字,因为在反向计算里小数位忽略了)。以下是Ali计算ASB近年的NAV。
-->
| 2016 | 2015 | 2014 | 2013 | 2012 | |
| Net Profit | 9,826,228,639 | 9,113,804,210 | 10,185,483,207 | 9,409,565,637 | 8,186,018,799 |
| Dividend | 9,652,031,840 | 10,255,139,610 | 9,983,987,277 | 9,220,053,849 | 7,990,096,967 |
| Dividend per unit | 6.75 | 7.25 | 7.5 | 7.7 | 7.75 |
| Bonus per unit | 0.5 | 0.5 | 1 | 1 | 1.15 |
| Manager Fee | 533,110,036 | 532,677,475 | 504,053,600 | 454,745,300 | 393,811,700 |
| %NAV | 0.35 | 0.35 | 0.35 | 0.35 | 0.35 |
| NAV | 142,665,121,303 | 141,938,424,676 | 134,031,327,009 | 120,707,174,722 | 104,527,531,604 |
| %Growth | 0.51% | 5.90% | 11.04% | 15.48% | |
| Total Expenses | 636,374,788 | 619,287,677 | 561,225,904 | 512,029,898 | 438,965,493 |
| %NAV | 0.45% | 0.44% | 0.42% | 0.42% | 0.42% |
有了NAV,再计算NAV per Unit。计算结果如下
-->
|
Unit RM1 setiap satu dibayar penuh |
144,443,000,000 | 142,543,000,000 | 137,373,000,000 | 127,373,000,000 | 110,298,000,000 |
| Add Units | 1,900,000,000 | 5,170,000,000 | 10,000,000,000 | 17,075,000,000 | |
| % Add Units | 1.33% | 3.76% | 7.85% | 15.48% | |
| NAV - Equity | -1,777,878,697 | -604,575,324 | -3,341,672,991 | -6,665,825,278 | -5,770,468,396 |
| NAV per unit | 0.9877 | 0.9958 | 0.9757 | 0.9477 | 0.9477 |
| Premium / (Discount) | 0.01 | 0.004 | 0.02 | 0.05 | 0.05 |
然后计算这个基金的表现
-->
| 2016 | 2015 | 2014 | 2013 | 2012 | |
| %Income | 7.25 | 7.75 | 8.50 | 8.70 | |
| %Capital Gain | -0.81 | 2.06 | 2.96 | -0.002 | |
| %Performance | 6.38 | 9.97 | 11.71 | 8.70 |
看表现很好6%-11%。
让我们再从它的投资股票组合看。组合里重仓是MAYBANK和SIME DARBY,各占20.49%,和15.35%。假如持有Maybank股份没有大变动,Maybank去年(2016)跌-2.38%,那么Maybank 的%NAV降到20.0023%。如此类推。
从基金里19项股票表现计算,它综合表现是-1.986%。另外12%的股票表现就不清楚了,不过只是占小数。还有另外非股票投资27.08%NAV,然后推磨其他表现,应该符合上面计算NAV Capital Gain/(Loss)= -0.81%。
-->
| 2016 Portfolio | %NAV | Return 1y (2016) | %NAV |
| 1. Malayan Banking Berhad | 20.49 | -2.38 | 20.002338 |
| 2. Sime Darby Berhad | 15.35 | 8.29 | 16.622515 |
| 3. Axiata Group Berhad | 3.46 | -26.37 | 2.547598 |
| 4. Maxis Berhad | 2.6 | -12.06 | 2.28644 |
| 5. Tenaga Nasional Berhad | 2.49 | 4.35 | 2.598315 |
| 6. Telekom Malaysia Berhad | 1.94 | -12.24 | 1.702544 |
| 7. Digi.Com Berhad | 1.83 | -10.56 | 1.636752 |
| 8. SP Setia Berhad | 1.77 | 23.04 | 2.177808 |
| 9. UMW Holdings Berhad | 1.55 | -41.93 | 0.900085 |
| 10. I&P Group Berhad | 0 | ||
| 11. Petronas Chemical Group Berhad | 1.38 | -3.99 | 1.324938 |
| 12. CIMB Group Holdings Berhad | 1.37 | -0.66 | 1.360958 |
| 13. Public Bank Berhad | 1.09 | 6.48 | 1.160632 |
| 14. MMC Corporation Berhad | 0.99 | 18.88 | 1.176912 |
| 15. MISC Berhad | 0.99 | -21.56 | 0.776556 |
| 16. IOI Corporation Berhad | 0.95 | -6.38 | 0.88939 |
| 17. Petronas Dagangan Berhad | 0.79 | -4.26 | 0.756346 |
| 18. Petronas Gas Berhad | 0.78 | -4.91 | 0.741702 |
| 19. Malaysia Airports Holdings Berhad | 0.64 | 8.02 | 0.691328 |
| 20. RHB Bank Berhad | 0.63 | -16.93 | 0.523341 |
| Total | 61.09 | -1.986 | 59.876498 |
| Other Investments | 27.08 | 1.8 | 27.56744 |
| Total | 88.17 | -0.823 | 87.443938 |
读到这里,你可能蒙查查,不知道Ali算什么。不用紧,Ali也不是专业查账人。
真正能给基金保持NAV在RM1左右,和派股息,是来自于基金的利息和投资股息收入RM9,826,228,639,派息总额RM9,652,031,840,那已经给以应付了。(Ali没有它在1997和2008年的年报,不能计算它在熊市时如何表现)
Ali猜利息和股息收入,应该能让它“安然”度过熊市。你也不妨考虑股息派投资法。这是神话背后的秘密。
另外ASNB也有推出浮动型基金,它就像我们一般熟悉的信托基金一样。其价格随基金表现变动。一共6项浮动基金,如下:
6项浮动基金
-->
| ASNB | Variable Price | |||||
| Symbol | ASN | ASN2 | ASN3 | ASG-Pendidikan | ASG-Kesihatan | ASG-Persaraan |
| Fund Name | Amanah Saham Nasional | Amanah Saham Nasional 2 | Amanah Saham Nasional 3 Imbang | Amanah Saham Gemilang - Pendidikan | Amanah Saham Gemilang - Kesihatan | Amanah Saham Gemilang - Persaraan |
| Type | Growth | Growth | Balanced | Income | Growth | Income |
| Category | Equity | Equity | Mixed | Income | Equity | Income |
| Launch Date | 20 April 1981 | 9 June 1999 | 16 October 2001 | 17 March 2003 | 17 March 2003 | 17 March 2003 |
| Eligibility | Bumiputera | Bumiputera | Malaysian | Malaysian | Malaysian | Malaysian |
| Minimum | 10 units | 100 units | 100 units | 100 units | 100 units | 100 units |
| Maximum | Unlimited | Unlimited | Unlimited | Unlimited | Unlimited | Unlimited |
| Fund Size | 1.895 b | 1.432 b | 1.131 b | 1.131 b | 1.131 b | 1.131 b |
| Sales Charge | 0.05 | 0.05 | 0.05 | 0.05 | 0.05 | 0.05 |
| Redemption Charge | None | None | None | None | None | None |
| Payment of Redemption | On-the-spot | On-the-spot | On-the-spot | On-the-spot | On-the-spot | On-the-spot |
| Financial Year End | 31 December | 30 June | 30 November | 31 March | 31 March | 31 March |
-->
| Divdend | ||||||
| Year | ASN | ASN2 | ASN3 | ASG-Pendidikan | ASG-Kesihatan | ASG-Persaraan |
| 1981 | 20 | |||||
| 1982 | 18 | |||||
| 1983 | 18 | |||||
| 1984 | 17.2 | |||||
| 1985 | 17.2 | |||||
| 1986 | 14 | |||||
| 1987 | 13 | |||||
| 1988 | 13.25 | |||||
| 1989 | 14.5 | |||||
| 1990 | 12.5 | |||||
| 1991 | 6.25 | |||||
| 1992 | 8.25 | |||||
| 1993 | 12.5 | |||||
| 1994 | 14 | |||||
| 1995 | 13 | |||||
| 1996 | 13.75 | |||||
| 1997 | 10.5 | |||||
| 1998 | 6.5 | |||||
| 1999 | 8.25 | |||||
| 2000 | 8 | 9 | ||||
| 2001 | 5 | 6.5 | ||||
| 2002 | 5 | 6 | 6 | |||
| 2003 | 5.3 | 5.3 | 7 | |||
| 2004 | 5.6 | 5.5 | 7.5 | 6.5 | 7 | 6.25 |
| 2005 | 5.5 | 5.5 | 7 | 7.25 | 7.3 | 6.75 |
| 2006 | 5.5 | 5 | 6.3 | 6.5 | 6.75 | 6.25 |
| 2007 | 6.25 | 5.2 | 8 | 6.5 | 6.75 | 6.25 |
| 2008 | 5.5 | 5.2 | 7 | 7 | 7.25 | 6.75 |
| 2009 | 5.2 | 5.2 | 5.5 | 5.5 | 6 | 5 |
| 2010 | 6 | 5.2 | 6 | 5.5 | 6 | 5 |
| 2011 | 6.05 | 5.5 | 6 | 5.6 | 6.1 | 5.1 |
| 2012 | 6.3 | 6.5 | 6.3 | 7 | 7.1 | 7.05 |
| 2013 | 6.45 | 7.1 | 6.4 | 7.1 | 7.2 | 7.3 |
| 2014 | 6.45 | 6.9 | 6.2 | 7.1 | 7.2 | 7.05 |
| 2015 | 6.1 | 3.45 | 6.2 | 7.1 | 7.2 | 7.05 |
| 2016 | 5 | 3.45 | 6 | 6 | 7 | 6.8 |
| 2017 | 4.5 | 4.25 | 5.15 | |||
| Average 10Y | 5.93 | 5.37 | 6.36 | 6.24 | 6.53 | 6.23 |
| Average 5Y | 6.00 | 5.23 | 6.20 | 6.18 | 6.41 | 6.51 |
| Average 3Y | 5.85 | 4.60 | 6.13 | 5.87 | 6.15 | 6.33 |
| Cumm. 10Y | 76.96 | 67.81 | 85.75 | 82.26 | 87.56 | 81.48 |
| Cumm. 5Y | 34.19 | 30.49 | 35.22 | 36.08 | 37.42 | 38.09 |
| Cumm. 3Y | 18.59 | 14.40 | 19.55 | 18.63 | 19.58 | 20.22 |
看看他们的表现与上面固定型基金不相上下,有5%-6%左右。但是他们的价格是浮动的。很少投资者买这基金时,留意价钱。NAV per Unit。这组基金就有变动报价。查看http://www.asnb.com.my/price.aspx
以ASN为例,从2013到2016,共获得24sen股息。投资时的价格大概是0.8495,好像赚了28%回报。不要被骗,还要看NAV。在2012时NAV是0.8495每单位。2016时是0.6637,下降了21%!!,就是你的资本缩水21%。虽然获得28%股息,4年累计净回报只是6.3%,化年CAGR只有1.4%而已。
-->
| 2016 | 2015 | 2014 | 2013 | 2012 | |
| NAV per unit | 0.6637 | 0.6822 | 0.7720 | 0.8815 | 0.8495 |
| Lowest NAV | 0.6484 | 0.6787 | 0.7981 | 0.8225 | 0.8127 |
| Highest NAV | 0.7144 | 0.8098 | 0.8977 | 0.9391 | 0.9046 |
| %Income | 7.53 | 8.94 | 8.36 | 7.32 | |
| %Capital Gain | -2.71 | -11.63 | -12.43 | 3.77 | |
| %Performance | 4.62 | -3.72 | -5.11 | 11.36 | 11.42 |
总结
Ali个人能力有限,不能对全部基金做分析,读者可以参考,自己研究。
如果你想投资固定收入,那ASNB 旗下的Fixed price fund是比私人公司信托基金(Income fund)好,又有价值保证,大约6%回报。而且ASNB的基金不是人人能买,有些只开放给Bumiputera,不过有3项ASW2020, ASM, AS1M 是给全部马来西亚公民,连6个月大的婴孩也可以投资。
下载:ASNB的计算Spreadsheet (里面还有对ASW2020基金用同样的计算)
注:
1. 没有买卖建议,Ali没有收取任何基金佣金,也没有利益冲突。如有负面评语,是以事论事。
2. 以上投资信托基金绩效,不包含sale charge成本,所以实际绩效来得低一些。
3. 这是转贴文章,读者可到http://aliinvest.blogspot.my留言
【十载投资,路在何方,扎根本土,放眼世界】
你可能有兴趣:
股息王:王者之风 Dividend Aristocrat
More articles on Ali Invest, Ali Blog
Discussions
8 people like this. Showing 9 of 9 comments
Asb has hidden agenda. They can always push their shares porfolio up when it comes to accounting time, sice EPF Khazanah PNB are major players in BSKL, they can 'help' asb to have a good return - To help certain race.
2017-05-27 12:14
The issue that caught my interest:
"很奇怪看不到NAV净资产的真正数字。买基金第一点就是看NAV,因为全部计算都是根据NAV计算。在年报里只是看到portfolio里有多少%是股票,多少%是债卷,没有直接列出NAV数字。为什么那么神秘?Ali也不知道。"
You know that's the most basic thing to know, but you don't know. Why don't you google it out.
长篇大论,What's the point of your article?
"如果你想投资固定收入,那ASNB 旗下的Fixed price fund是比私人公司信托基金(Income fund)好,又有价值保证,大约6%回报。"
This is your conclusion, but I still don't see reason why you're saying so. Can you say for sure that your statement is correct?
Ok lah, just for sharing. I also learned something from your article. Learning by writing mah. 自己写,自己爽。
2017-05-27 15:15
Please read the report page 27 about the manager fee, ".... dikira dan diakru secara harian....". So your estimation on NAV could be very far away from the actual number because the market (and NAV) went up and down during the year.
2017-05-27 15:47
@leoting
谢谢阅读,游览http://aliinvest.blogspot.my/ 更多精彩文章。
@Hiu
"Windows dressing" 全部基金都会做,不只是ASNB。长期还是回归价值。
@Albukhary
谢谢阅读,游览http://aliinvest.blogspot.my/ 更多精彩文章。
@TKL
谢谢鼓励
@bugle
抱歉,Ali未能表达其意。只是个人剪接,多多包涵
@i3gambler
是啊,已经说明NAV只是估计,不是真正数字。你有更准确的方法计算吗?多多指教
2017-05-28 06:58
Post a Comment
Featured Posts
Introducing MY's First IPO Fund for Sophisticated Investors!
New Update. Discover investment communities that resonate with your ideas
M & A Value Partners IPO Equity Fund has been launched - Targeted 13% Return p.a
Latest Videos


Apps


Top Articles
1
CEO Morning Brief
2
3
Good Articles to Share
US Army veteran plows truck into New Orleans crowd - Five stories you need to know | Reuters
4
Good Articles to Share
‘THINGS ARE GETTING WORSE’: Credit card debt skyrocketing to concerning levels #shorts
5
Good Articles to Share
Apple offers iPhone discounts in China as competition intensifies | REUTERS
6
Good Articles to Share
New Orleans, Tesla truck explosion, Gazprom and the debt ceiling
7
CEO Morning Brief
8
#
Stock
Score
Daily Stocks
Stock Name
Last
Change
Volume
Stock Name
Last
Change
Volume
Stock Name
Last
Change
Volume
MQ Trading Signals
Stock
Time
Signal
Duration
Stock
Time
Signal
Duration
Featured Advertisers / Partners


Ride The Bull Short The Bear
CS Tan
4.9 / 5.0
This book is the result of the author's many years of experience and observation throughout his 26 years in the stockbroking industry. It was written for general public to learn to invest based on facts and not on fantasies or hearsay....
leoting
Very good article
2017-05-27 11:23