Stocks on Radar - Gamuda (5398)
AmInvest
Publish date: Wed, 09 Sep 2020, 10:53 AM

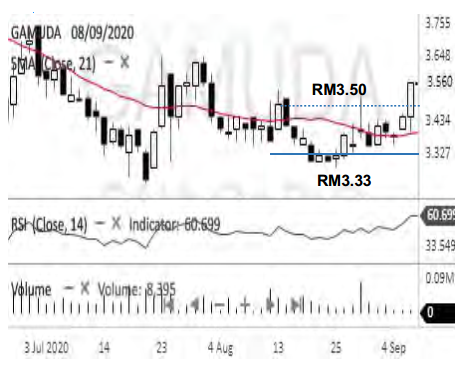
Gamuda jumped and touched the RM3.50 resistance level. With its RSI indicator pointing upwards, coupled with a higher high candlestick pattern, we think that the bullish momentum will soon push towards the technical target price of RM3.70 followed by RM3.77. In this case, the downside support is marked at RM3.33, whereby traders may exit on a breach to avoid the risk of a further correction
Trading Call: Buy on pullback RM3.50
Target: RM3.70, RM3.77 (time frame: 2-4 weeks)
Exit: RM3.33
Source: AmInvest Research - 9 Sept 2020
Related Stocks
| Chart | Stock Name | Last | Change | Volume |
|---|
Market Buzz
2024-11-25
GAMUDA2024-11-25
GAMUDA2024-11-25
GAMUDA2024-11-25
GAMUDA2024-11-23
GAMUDA2024-11-22
GAMUDA2024-11-22
GAMUDA2024-11-22
GAMUDA2024-11-22
GAMUDA2024-11-21
GAMUDA2024-11-21
GAMUDA2024-11-21
GAMUDA2024-11-20
GAMUDA2024-11-20
GAMUDA2024-11-20
GAMUDA2024-11-20
GAMUDA2024-11-19
GAMUDA2024-11-19
GAMUDA2024-11-19
GAMUDA2024-11-19
GAMUDA2024-11-19
GAMUDA2024-11-18
GAMUDA2024-11-18
GAMUDA2024-11-18
GAMUDA2024-11-18
GAMUDA2024-11-15
GAMUDA2024-11-15
GAMUDA2024-11-15
GAMUDA2024-11-15
GAMUDA2024-11-15
GAMUDA2024-11-15
GAMUDA2024-11-15
GAMUDA2024-11-14
GAMUDAMore articles on AmInvest Research Reports
Created by AmInvest | Nov 25, 2024
Created by AmInvest | Nov 21, 2024


