Focus Dynamics: last 10 trading days collection. (Updated)
BLee
Publish date: Sun, 05 Sep 2021, 12:09 AM
One of my share market barometers of performance are participation of 3 major investors grouping as shown in Table No.1 below.
Based on my observation, if Institutions are the net buyers, all blue chips and CI related counters will move up. Reason: Stability in price, good dividend and long term profitability of the investment.
Usually, Retailers look at short term trading and speculative counters. The buying trends are non-predictive, bullish at one moment and can be bearish at the very next moment.
Why am I more interested in Foreign funds as net buyers? Usually, with inflow of funds from external sources, we can observed that the whole market will improve in tandem. As shown in Table No.1, only Local Retailers are net buyers at 38.83%; the market direction will very much depend on retailers confidence...
I have been publishing/updating below table No.1 for the last few days at Focus D i3 investor forum. Hopefully, this tabulation can draw the correlation of the increase of Foreign investors' fund with respect to driving the overall bullishness in local market down to penny stocks. As I have also observed of major collection at Focus D the last few days, hopefully this will also drive Retailers interest in Focus D. My typical publishing as shown in "..." below:-
"Only retailers as majority net buyer. Yesterday (20 Sept., 2021) trading status:-
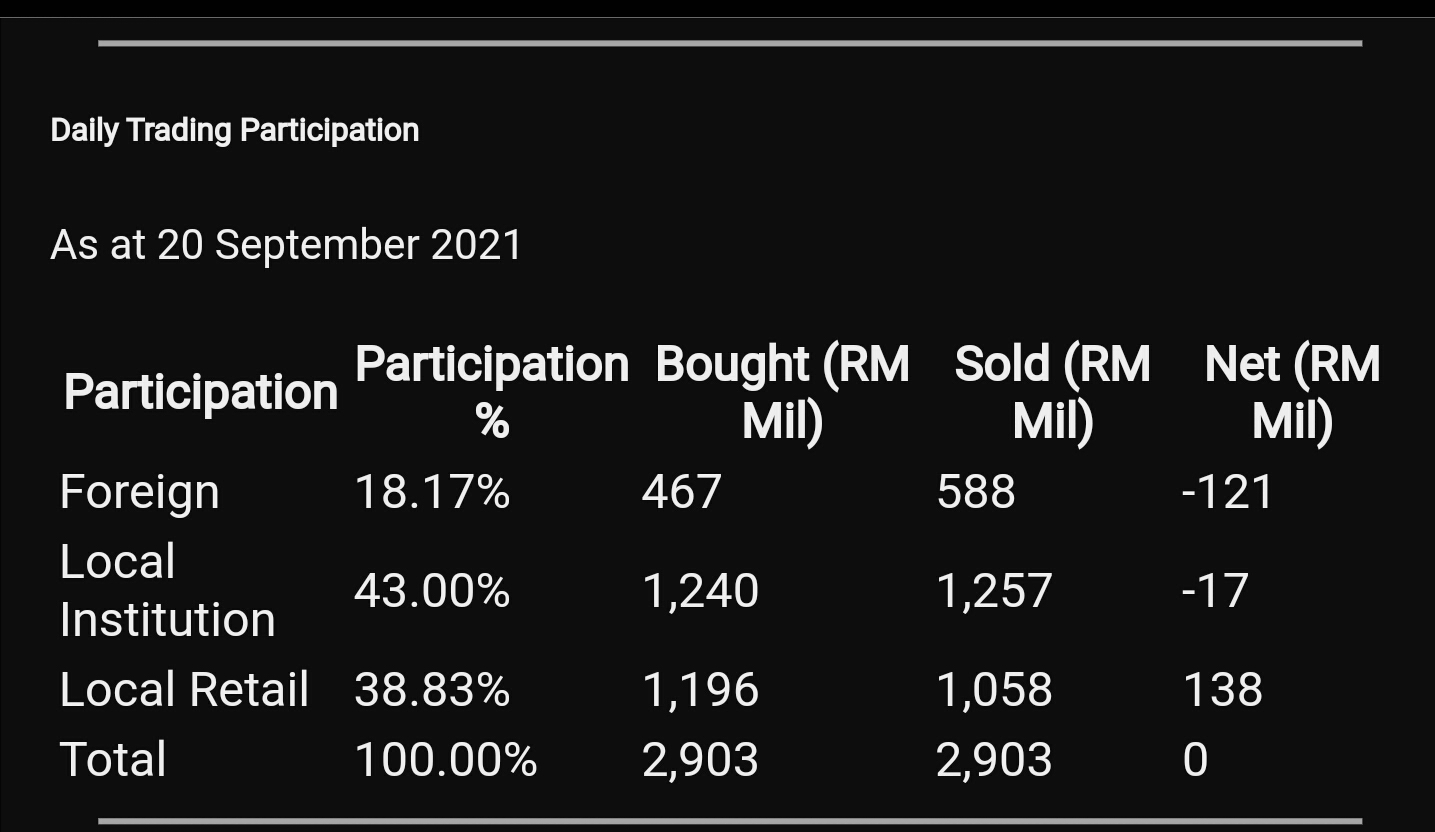
Table No.1: The 3 categories of investors participation details.
Source: https://www.bursamalaysia.com/market_information/market_statistic/securities
Please visit link for latest Table No.1 update.
Weekly report reference link:
https://www.nst.com.my/business/2021/09/724706/nearly-rm800mil-net-inflow-foreign-investors-bursa-last-week and special report:
https://www.malaymail.com/news/malaysia/2021/09/11/tengku-0zafrul-foreign-capital-inflows-signal-malaysias-brightening-prospect/2004751
https://www.malaymail.com/news/money/2021/09/15/asian-stocks-stumble-as-weak-china-data-fan-global-growth-worries/2005690
https://klse.i3investor.com/blogs/savemalaysia/596106.jsp
Good days are far reaching for Focus D? It seems collection by Fintec has stopped since reaching above 30%. The tussle continues...(See Table No.3, Graphs No.1 & 2 for the tussle at 5.5 to 6sen and Graphs No. 3, 4 and 5 for the tussle at 6 to 6.5sen.)
Change of holdings:
1) Date: 23 Aug. 2021, 2,759,000 shares Acquired, Indirect Interest, Name of registered holder: Fintec Global Limited
2) Date: 24 Aug. 2021, 52,000,000 shares Acquired, Indirect Interest, Name of registered holder: Fintec Global Limited
3) Date: 25 Aug. 2021, 93,500,000 shares Acquired, Indirect Interest, Name of registered holder: Fintec Global Limited
4) Date: 26 Aug. 2021, 12,500,000 shares Acquired, Indirect Interest, Name of registered holder: Fintec Global Limited
5) Date: 27 Aug. 2021, 30,000,000 shares Acquired, Indirect Interest, Name of registered holder: Fintec Global Limited
6) Date: 30 Aug. 2021, 10,000,000 shares Acquired, Indirect Interest, Name of registered holder: Fintec Global Limited
7) Date: 1 Sept. 2021, 24,142,400 shares Acquired, Indirect Interest, Name of registered holder: Fintec Global Limited
8) Date: 2 Sept. 2021, 14,090,700 shares Acquired, Indirect Interest, Name of registered holder: Fintec Global Limited
9) Date: 3 Sept. 2021, 8,053,100 shares Acquired, Indirect Interest, Name of registered holder: Fintec Global Limited
10) Date: 6 Sept. 2021, 35,654,800 shares Acquired, Indirect Interest, Name of registered holder: Fintec Global Limited
Fintec Global Limited holding of Focus D as at 6th Sept. 2021:-
Indirect/deemed interest (%): 30.631
Total no of securities after change: 1,951,897,076
Total: 282,700,000 Shares collected within 10 days, collection stopped at 6 Sept. 2021?? Major collection, most probably patiently at 4 to 5.5 sen only!!
Total collected/Total traded over last 10 days:
282,700,000 / 483,156,776 = 58.5%
- probable average gain: (5.5-4)/4 = 37.5%"
Update: Announcement of collection by Fintec not forthcoming; most likely breather at around 30%...
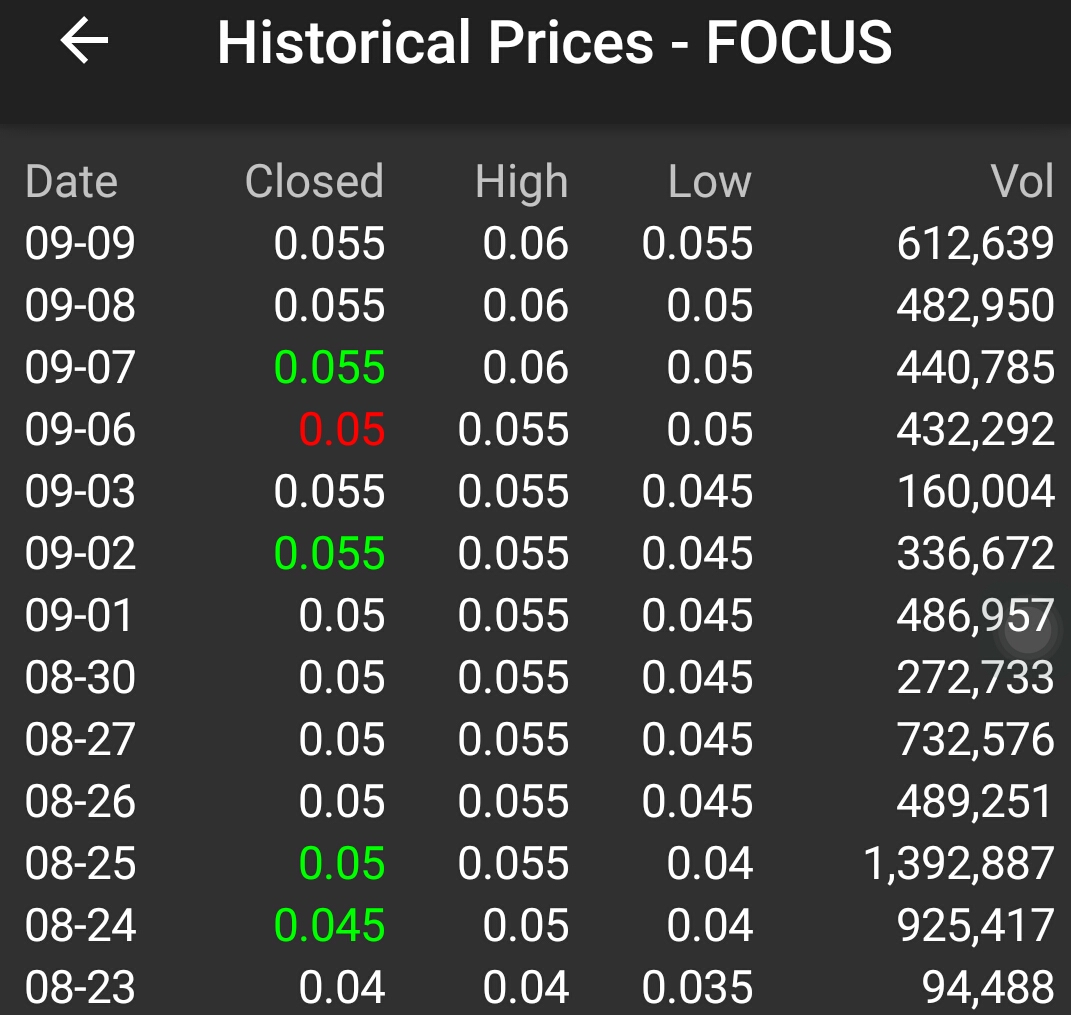
Table No.2: Trading volume of the 10(+3) days.
- 23 Aug. 2021: 2,759,000/9,448,800= 29.2%
- 24 Aug. 2021: 52,000,000/92,541,700 = 56.2%
- 25 Aug. 2021: 93,500,000/139,288,700 = 67.1%
- 26 Aug. 2021: 12,500,000/48,925,100 = 25.6%
- 27 Aug. 2021: 30,000,000/73,257,600 = 40.9%
- 30 Aug. 2021: 10,000,000/27,273,300 = 36.7%
- 1 Sept. 2021: 24,142,400/48,695,700 = 49.6%
- 2 Sept. 2021: 14,090,700/33,667,200 = 41.9%
- 3 Sept. 2021: 8,053,100/16,000,400 = 50.3%
- 6 Sept. 2021: 35,654,800/43,229,200 = 82.5%
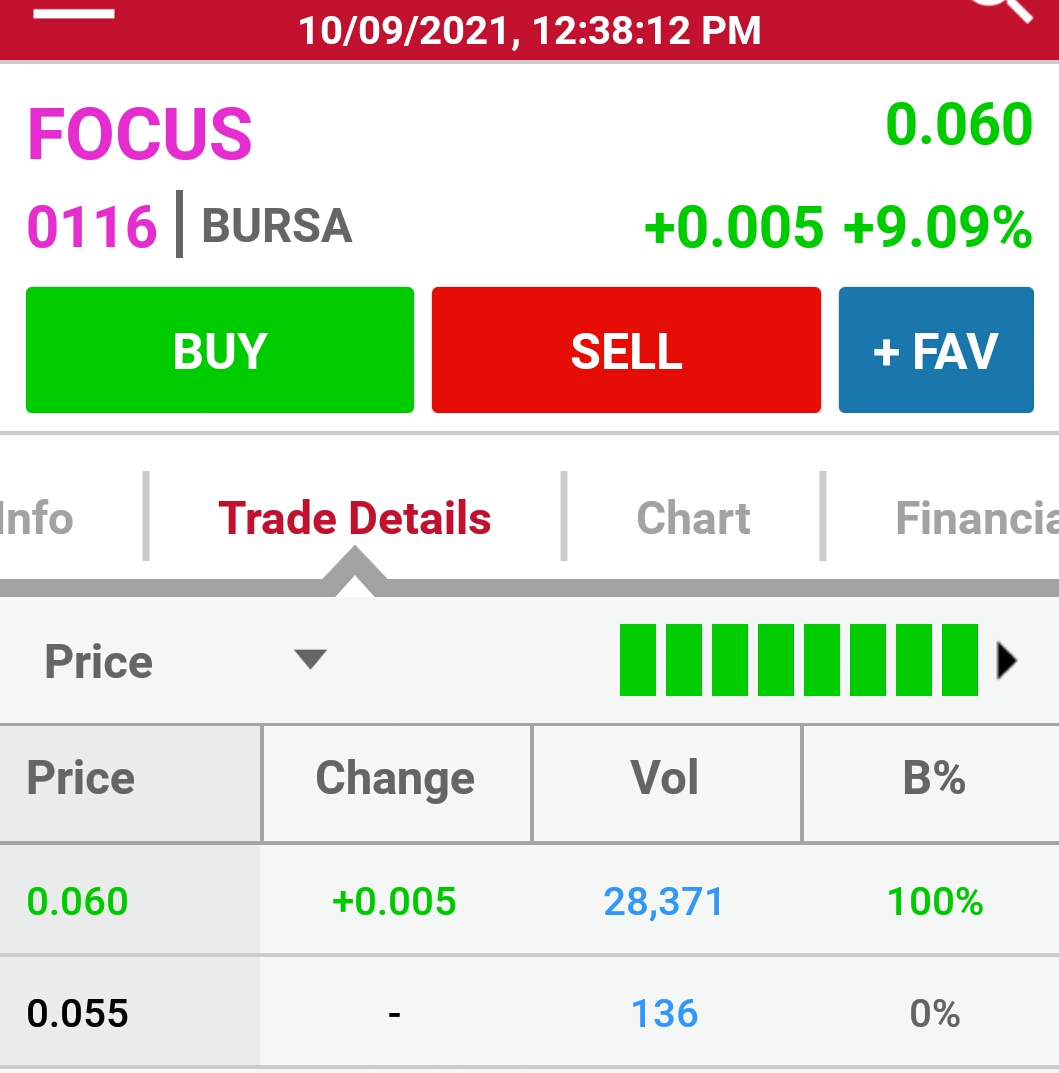
Table No.3: Today (10th Sept. 2021) first half-Morning traded almost all at 6 sen?

Graph No.1: High volume clearing at 5.5 sen in the early Morning of 7th Sept. 2021. TradeAtYourOwnRisk (TAYOR).
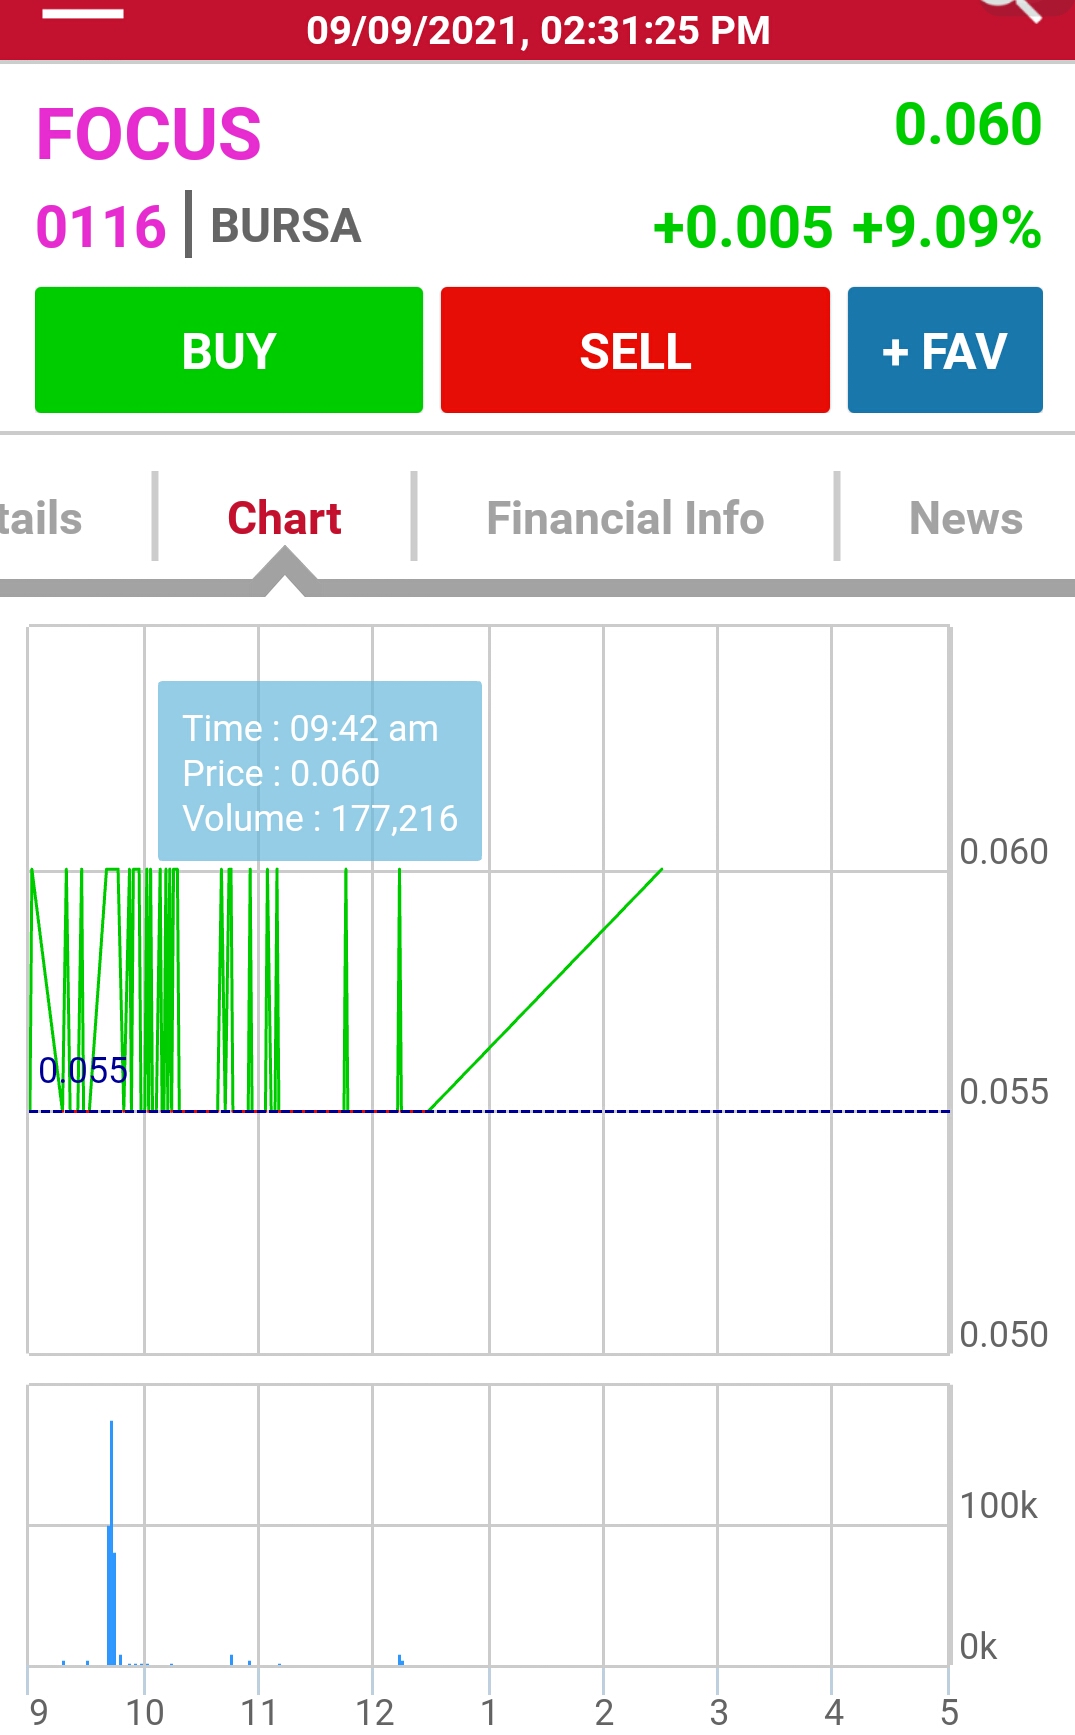
Graph No.2: High volume clearing at 6 sen in the Morning of 9th Sept. 2021. Uptrend seems still intact.
TradeAtYourOwnRisk.
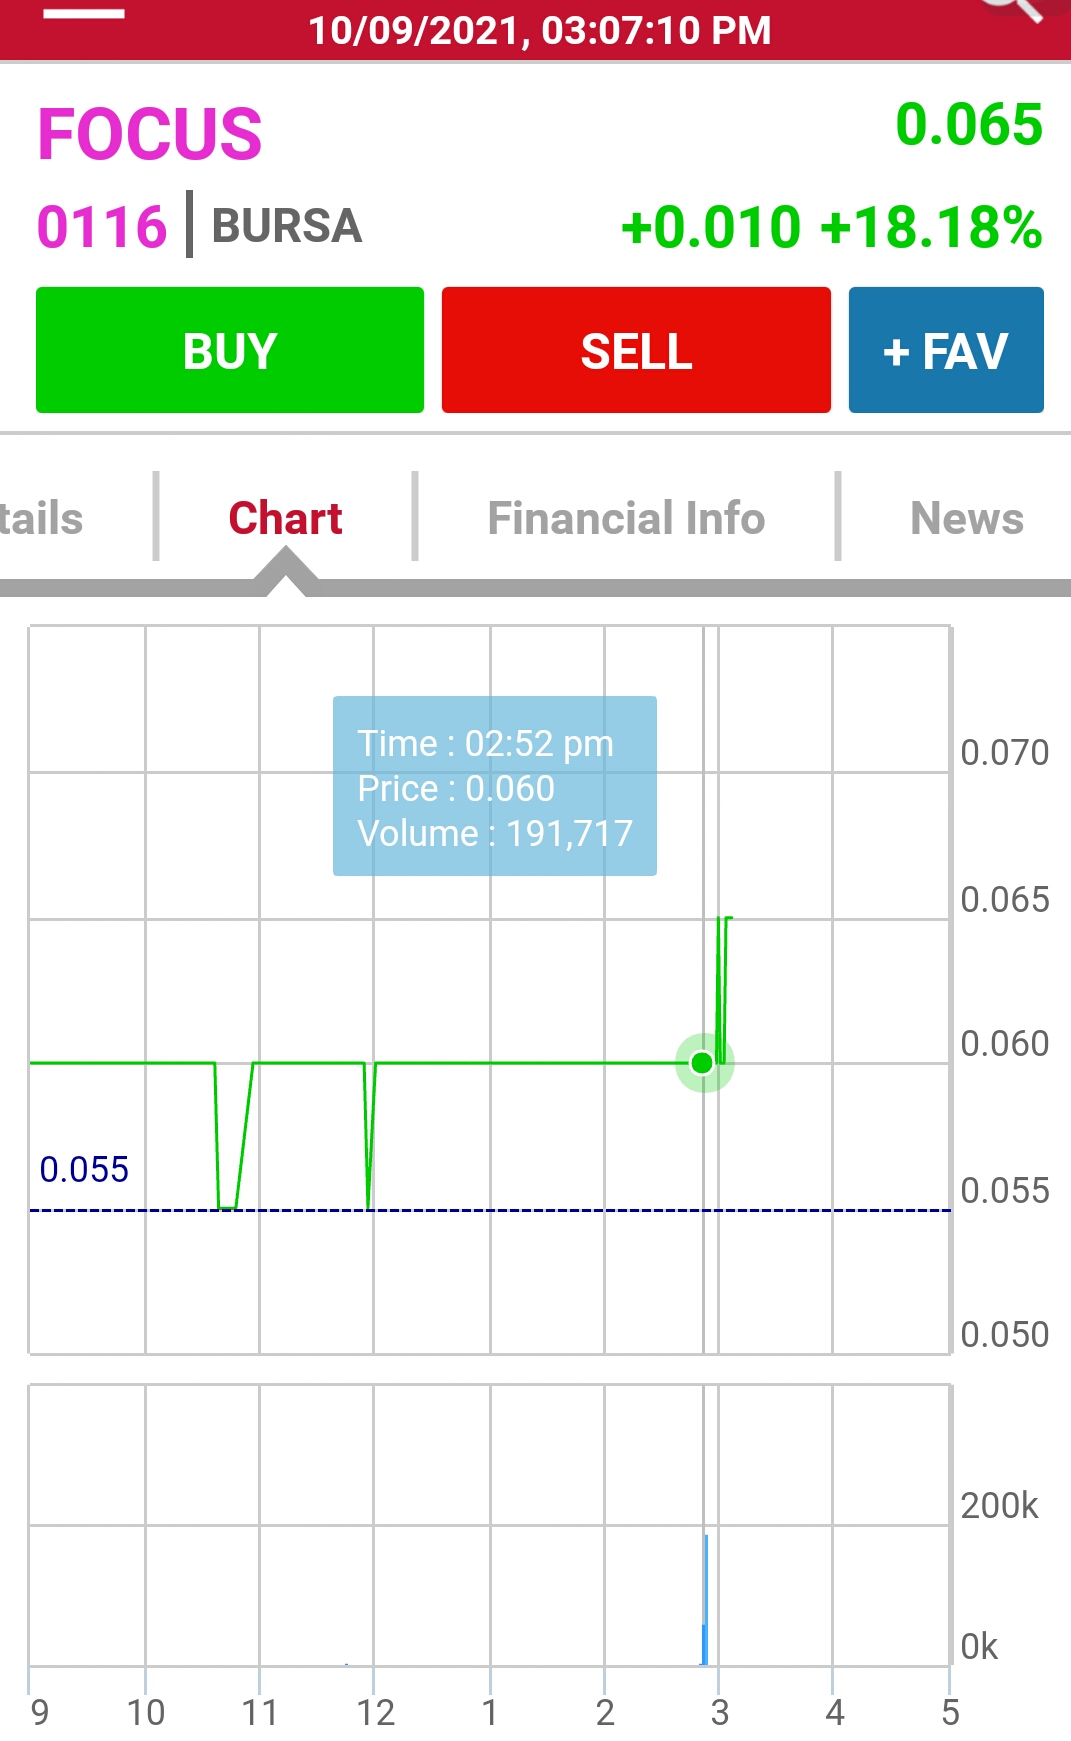
Graph No.3: High volume buying at 6 sen in the Afternoon of 10th Sept. 2021; thereafter reached 6.5 sen.
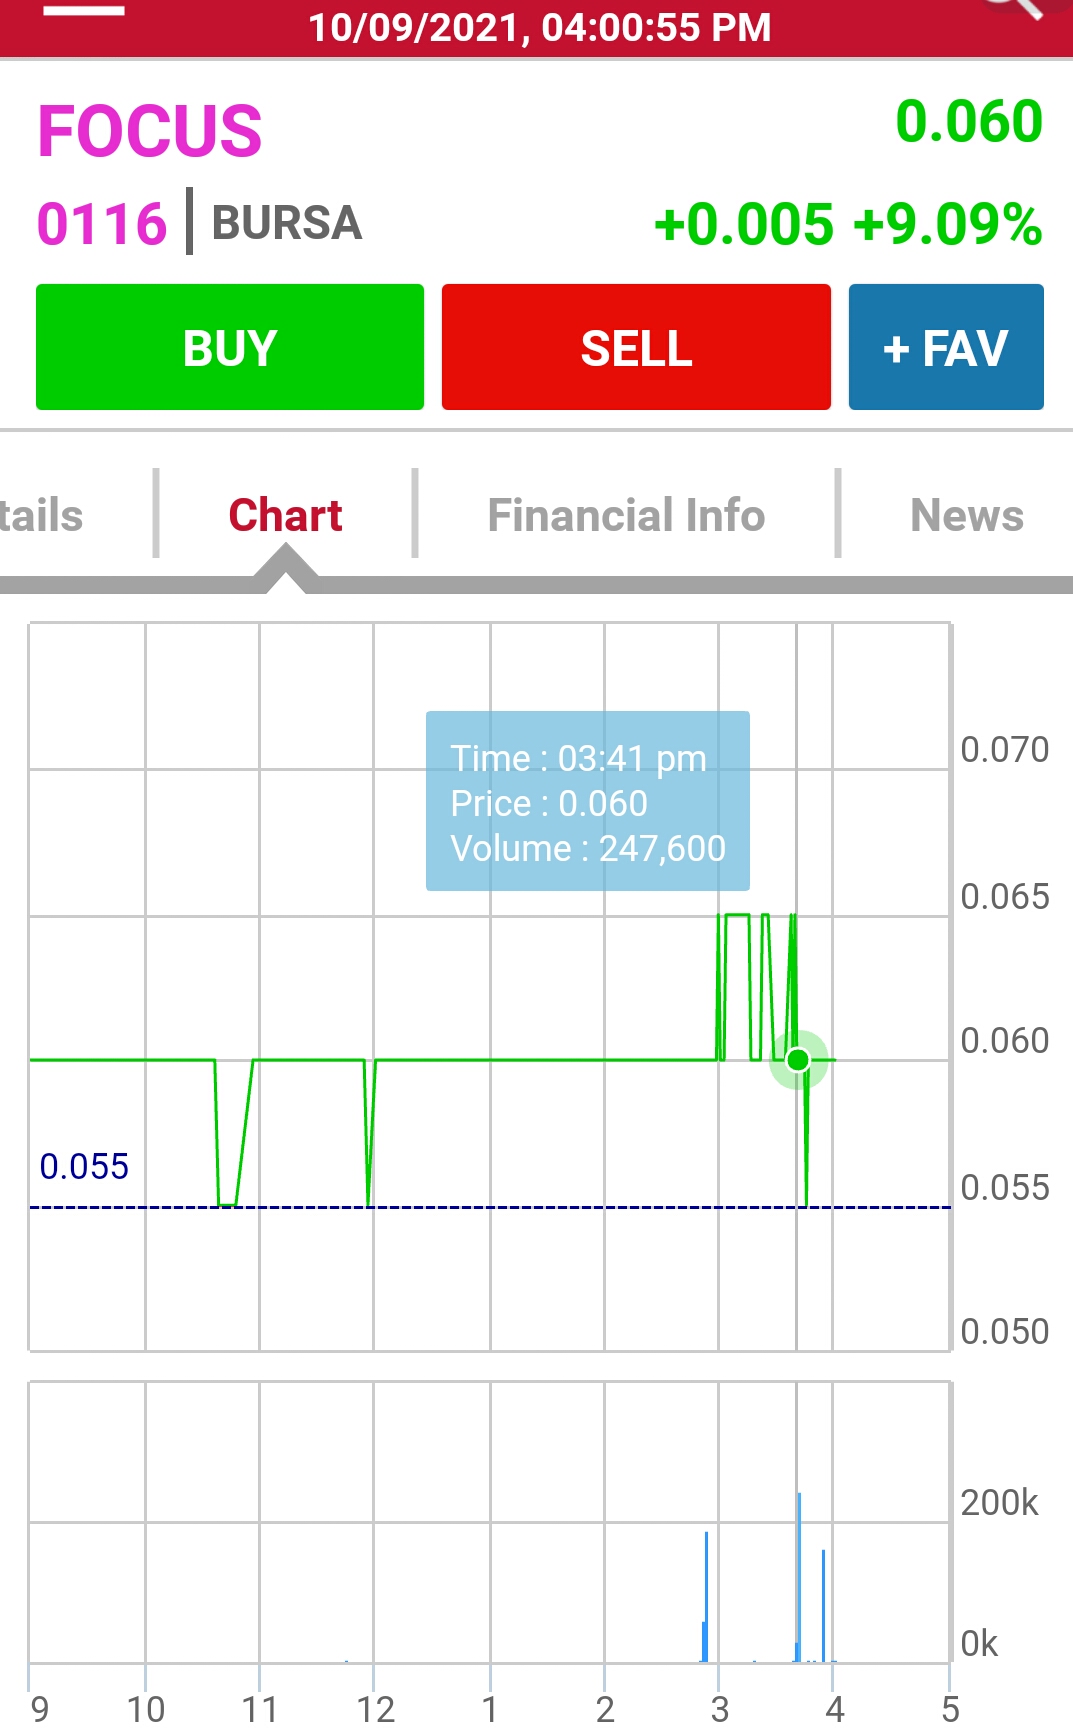
Graph No. 4: High volume selling at 6/6.5 sen in the Afternoon of 10th Sept. 2021. Now the direction can go either ways. TradeAtYourOwnRisk
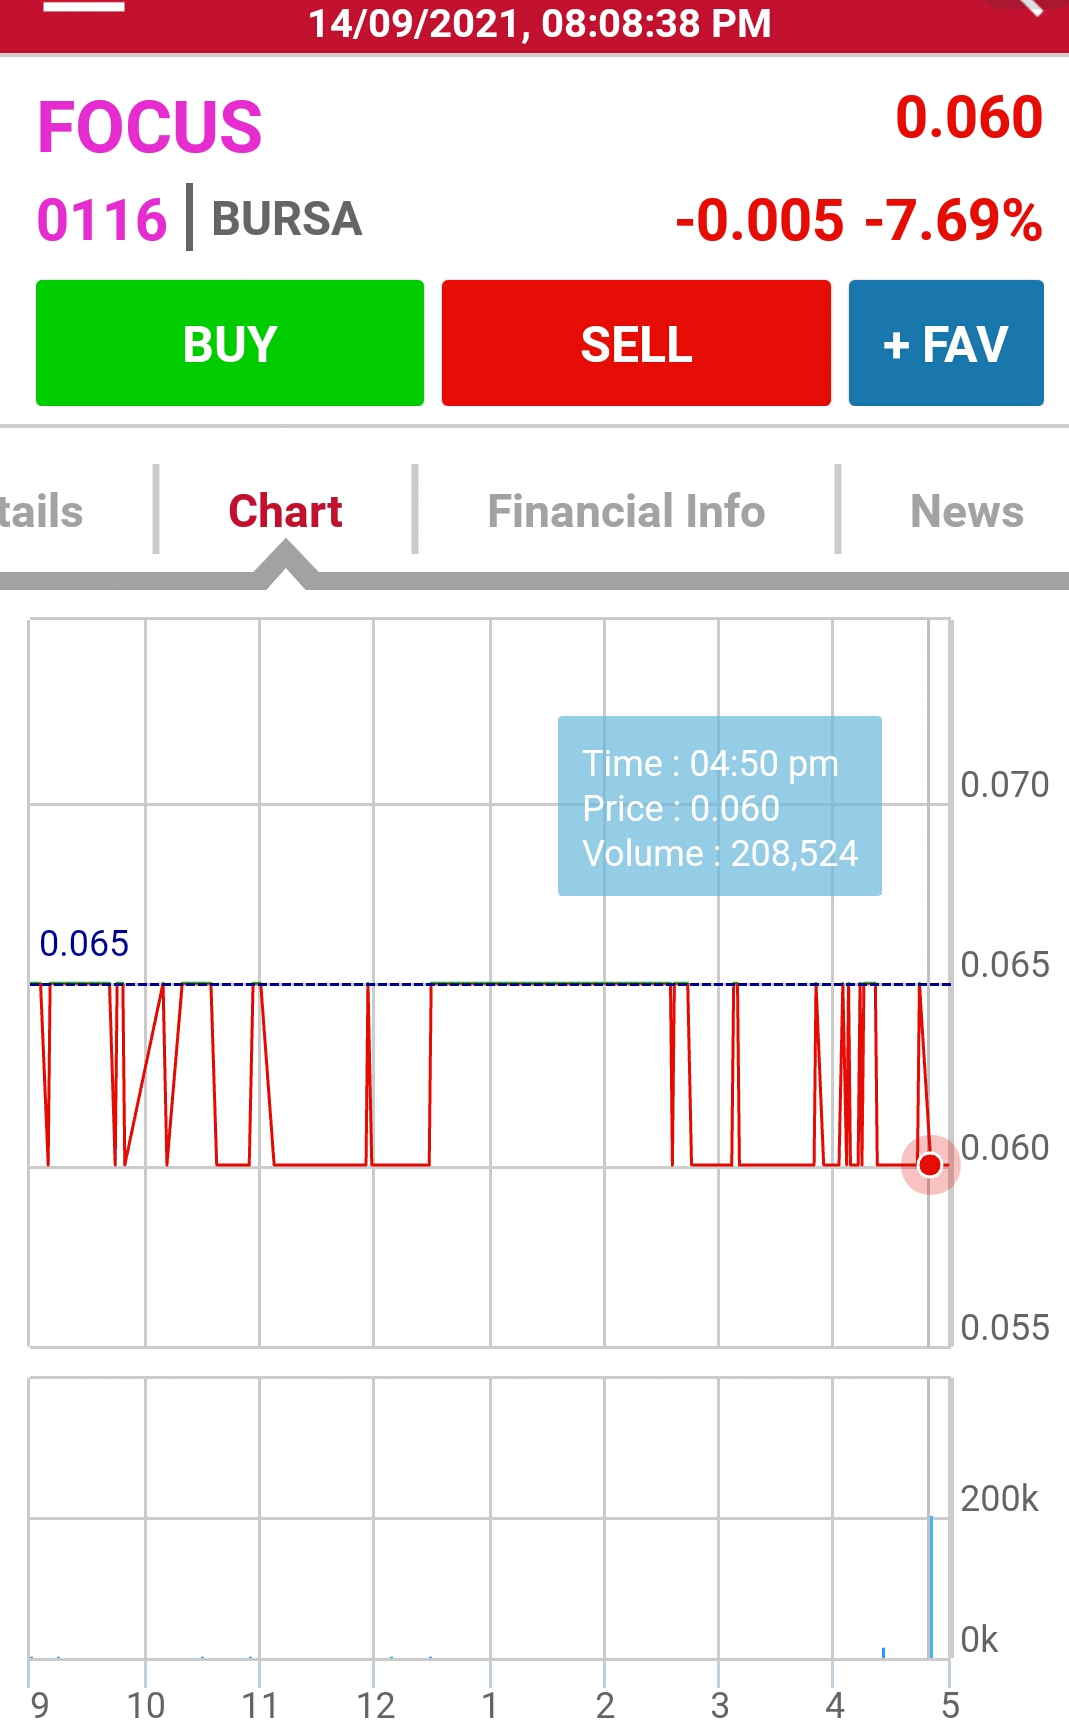
Graph No. 5: High volume last minute (day end of 14 Sept. 2021) selling at 6sen. It is everybody guess on the next direction..
Source of data: klse screener and various website.
Caution: I am only highlighting the positive side, please perform your own due diligence on the negative side.
Happy Trading.
Disclaimer: The above opinion does not represent a buy, hold or sell recommendation; just a personal opinion and for sharing purposes only. Any offences and errors are unintentional; my apology in advance.
Related Stocks
| Chart | Stock Name | Last | Change | Volume |
|---|
More articles on ICPS: It takes AGES to reach the Billion Shares Club
Created by BLee | Jan 01, 2023
Continuation of article on previous ICPS investment strategy.
Created by BLee | Mar 08, 2021


