


Dow Updates
DOW Major Correction Coming? Fibonacci Analysis Tell Something

InvestorsDoctor
Publish date: Thu, 19 Oct 2017, 04:55 PM
InvestorsDoctor
0 1,969
To get more information on local and foreign futures markets, join us on telegram & Facebook.
Join link: https://t.me/investorsdoctoracademy
Facebook: https://m.facebook.com/investorsdoctoracademy/
Join link: https://t.me/investorsdoctoracademy
Facebook: https://m.facebook.com/investorsdoctoracademy/
In the history of Dow Price Chart, major correction always happened at 1.618^n. All The horizontal lines showing the power of 1.618 from 1929, 1984 & 2009. And 3 of the ratios coming from different price level and time overlapping at the price zone 21307 to 22974. Such a coincidence. Will the historic repeat itself and a major correction to happen anytime from now? We Shall See.

What you can see here, 2008 was projected 13184 by using 1929 price swing. And the market had the famous sub prime crisis on the price zone.
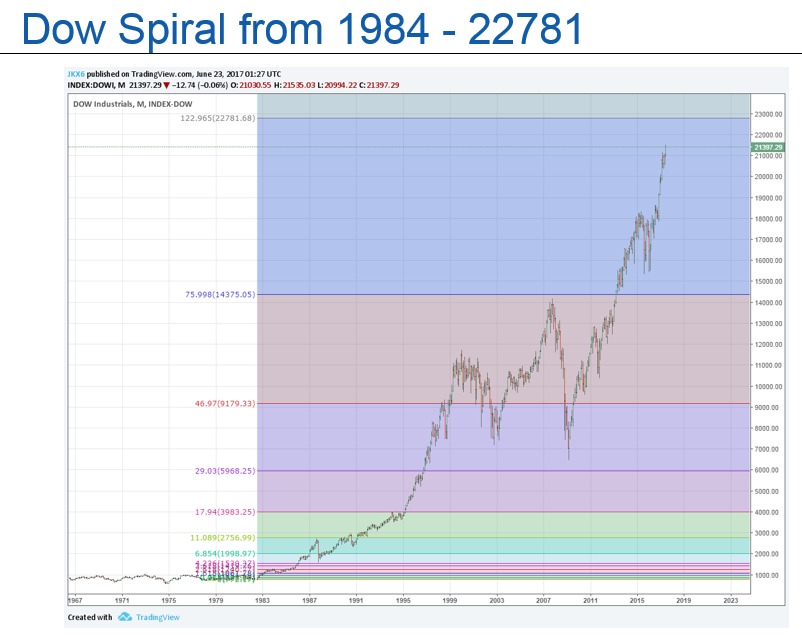
Same to 1929, 2008 was captured by 1984 projection.
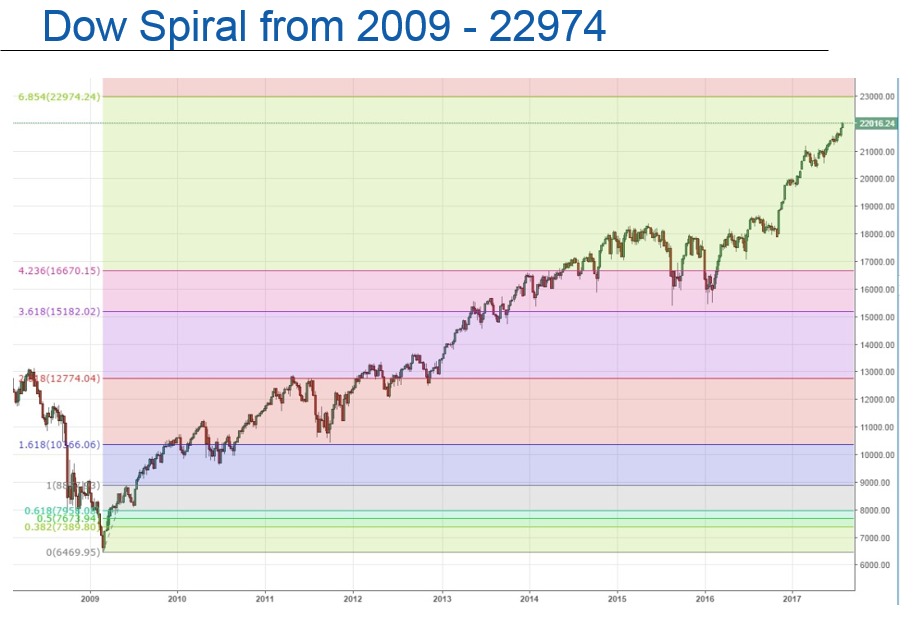
2009 projection pointing 22974...will this be the one? If you look carefully, 2011 was clearly captured by the projection.
We are applying this method on our daily analysis and posting in lower time frame, and it never stop amazed us. The high and low of the cycling can be captured and projected accurately when the user capable to apply it correctly and wisely.
For reference only, and if you want to now more please contact us.
To get more information on local and foreign futures markets, join us on telegram & Facebook.
Join link: https://t.me/investorsdoctoracademy
Facebook: https://m.facebook.com/investorsdoctoracademy/
More articles on Dow Updates
Daily Futures Commentaries: [Mini Dow Jones] 27/12/2019 - New high, year end rally continue
Created by InvestorsDoctor | Dec 27, 2019
Discussions
Be the first to like this. Showing 4 of 4 comments
Was the economic situation in 2008 and now similar? Do you need to take the overall economic situation into consideration or just base on chart comparision?
2017-10-20 07:43
If you really have read the old-skool Elliott Wave theory book by Pretcher before, you should know that the Fibonacci ratio works for percentage gain, not on point gains.
Not sure from where have you learnt about the Fibonacci ratio,but the way you employing it was incorrect.
And for proper charting, one uses only log scale especially for long term chart.
K thx bye.
2017-11-02 15:06
Post a Comment
Featured Posts
New Update. Discover investment communities that resonate with your ideas

Apps


Top Articles
1
https://dividendguy67.blogspot.com
3
4
Good Articles to Share
Could Kamala Harris beat Donald Trump in November's presidential race?
5
Good Articles to Share
Iranian warship capsizes during repairs in port of Bandar Abbas
6
Good Articles to Share
7
Good Articles to Share
Jonathan Turley unveils exciting new book 'Free Speech in the Age of Rage'
8
Good Articles to Share
Why Impossible Foods signed hot dog-eating legend Joey Chestnut #yahoofinance #youtubeshorts
#
Stock
Score
Daily Stocks
Stock Name
Last
Change
Volume
Stock Name
Last
Change
Volume
Stock Name
Last
Change
Volume
MQ Trading Signals
Stock
Time
Signal
Duration
No trading signals available.
Stock
Time
Signal
Duration
No trading signals available.
Featured Advertisers / Partners


Ride The Bull Short The Bear
CS Tan
4.9 / 5.0
This book is the result of the author's many years of experience and observation throughout his 26 years in the stockbroking industry. It was written for general public to learn to invest based on facts and not on fantasies or hearsay....
Thkent91
Your 1.618^n got so much tolerance one ah? i see around 10-20% tolerance.you think mr market will ngam ngam take fib number can causes crashes? if so einstein and edision have already makes trillions of dollars
2017-10-19 23:41