Dow Updates
16 Nov - Dow in Correction Mode
InvestorsDoctor
Publish date: Thu, 16 Nov 2017, 02:14 PM
16/11/2017
US Mini Dow Jones Dec 17
Yesterday close : 23262 -113

Index closed lower yesterday as dragged down by energy stocks amid of falling oil price, despite the positive CPI & retail sales data.
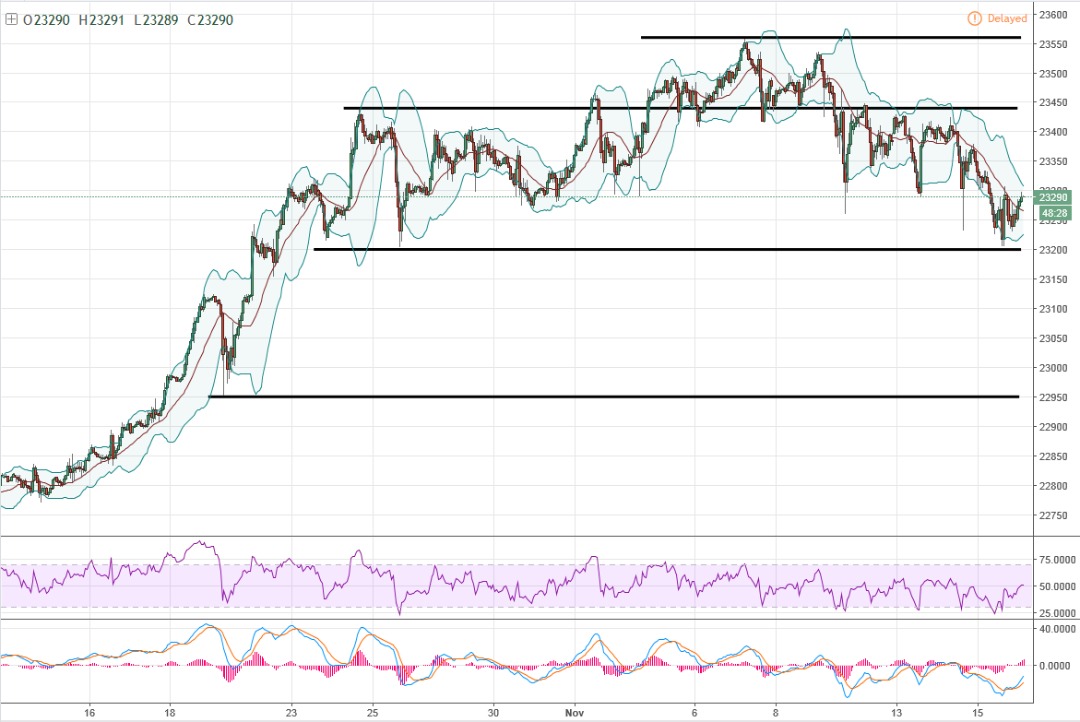
Daily chart's RSI and MACD crossing down but BB still going up as index sustain above botttom line of BB, show that overall trend is bullish with overbought correction in short term. Hourly chart show index rebound from RSI oversold, also the support level of 23200.
Price level to watch out today:
Support 23200 22950
Resistance 23440 23560
Recommended trading plan today:
1. Look for sell signal if break lower low of 23200.
Margin Requirement (per lot):
USD 3685
Disclaimer: Idea sharing only, trade at your own risk.
More articles on Dow Updates
Daily Futures Commentaries: [Mini Dow Jones] 27/12/2019 - New high, year end rally continue
Created by InvestorsDoctor | Dec 27, 2019
Discussions
Be the first to like this. Showing 0 of 0 comments


