


Dow Updates
Daily Futures Commentaries: [Mini Dow Jones] 26/6/2018 - Erase its 1st day recovery with a sharp fall over trade war fears

InvestorsDoctor
Publish date: Tue, 26 Jun 2018, 12:32 PM
InvestorsDoctor
0 1,969
To get more information on local and foreign futures markets, join us on telegram & Facebook.
Join link: https://t.me/investorsdoctoracademy
Facebook: https://m.facebook.com/investorsdoctoracademy/
Join link: https://t.me/investorsdoctoracademy
Facebook: https://m.facebook.com/investorsdoctoracademy/
26/6/2018
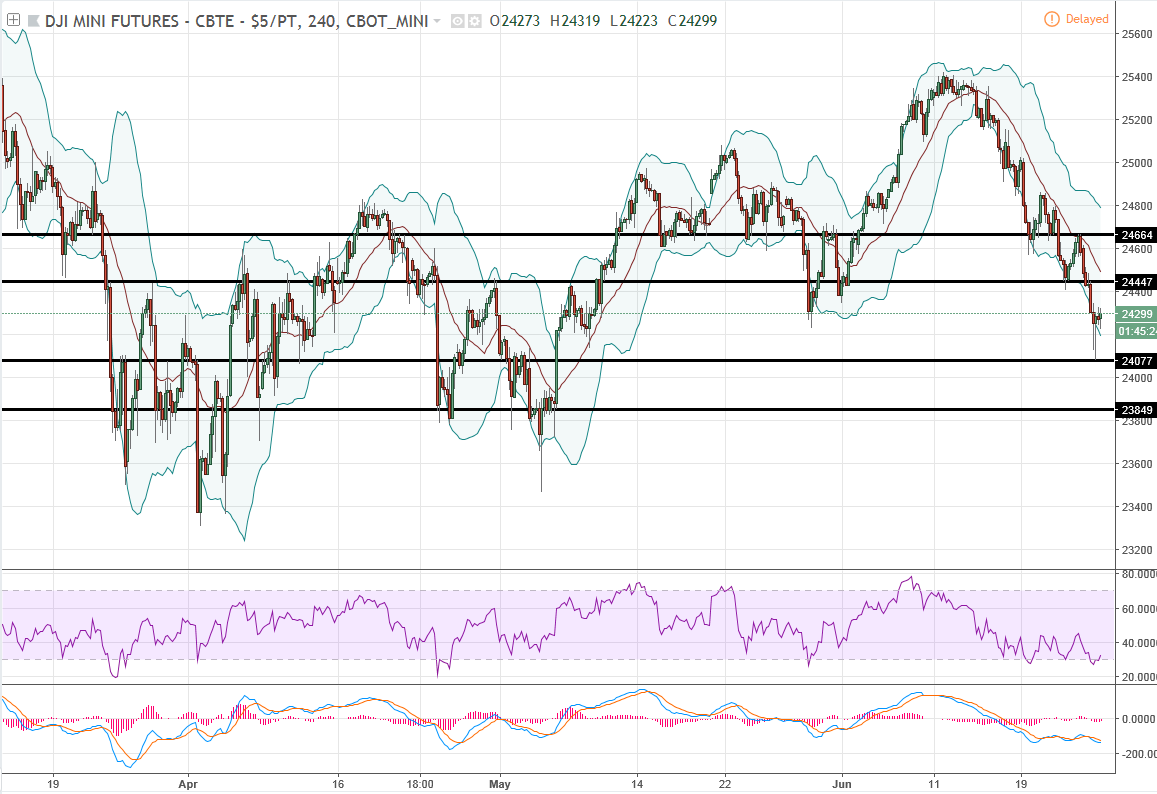
*US Mini Dow Jones Sep 18*
Yesterday close : 24279 -320
DJI fell more than 300pts on escalating global trade dispute.
Daily chart show mixed signals, while hourly chart formed lower low, around the range since May, show potential correction ahead.
*Classic Support & Resistance*
Support: 24077 23849
Resistance: 24447 24664
*Recommended trading plan today:*
1. Look for buy signal above day high 24323
*Margin Requirement (per lot):*
USD 5390
Join our channels to find out more!
Telegram link:
https://t.me/investorsdoctoracademy
Facebook link: https://m.facebook.com/investorsdoctoracademy
Since 14th May 2018 (stock market reopened after 509 GE-14), FKLI Futures dropped nearly 200.5 points from high 1876.5 to recent low 1676!
Simple Calculation:
200.5 x RM 50 per index point = RM 10,025 (Potential Profit!)
Well, NOW is the time for you to understand more about FKLI Trading!
Come & Join us on 14th July 2018 from 2PM to 4PM at SI Academy.
IDA will discover together with You - What is FKLI............
https://goo.gl/forms/SyxDaLNwkuYagkA02
More articles on Dow Updates
Daily Futures Commentaries: [Mini Dow Jones] 27/12/2019 - New high, year end rally continue
Created by InvestorsDoctor | Dec 27, 2019
Discussions
Be the first to like this. Showing 0 of 0 comments
Post a Comment
Featured Posts


Apps


Top Articles
1
https://dividendguy67.blogspot.com
3
4
Good Articles to Share
Could Kamala Harris beat Donald Trump in November's presidential race?
5
Good Articles to Share
Iranian warship capsizes during repairs in port of Bandar Abbas
6
Good Articles to Share
7
Good Articles to Share
Jonathan Turley unveils exciting new book 'Free Speech in the Age of Rage'
8
Good Articles to Share
Why Impossible Foods signed hot dog-eating legend Joey Chestnut #yahoofinance #youtubeshorts
#
Stock
Score
Daily Stocks
Stock Name
Last
Change
Volume
Stock Name
Last
Change
Volume
Stock Name
Last
Change
Volume
MQ Trading Signals
Stock
Time
Signal
Duration
No trading signals available.
Stock
Time
Signal
Duration
No trading signals available.
Featured Advertisers / Partners


Ride The Bull Short The Bear
CS Tan
4.9 / 5.0
This book is the result of the author's many years of experience and observation throughout his 26 years in the stockbroking industry. It was written for general public to learn to invest based on facts and not on fantasies or hearsay....