


Dow Updates
Daily Futures Commentaries: [Mini Dow Jones] 9/8/2018 - Retreat from high on trade war tension

InvestorsDoctor
Publish date: Thu, 09 Aug 2018, 12:32 PM
InvestorsDoctor
0 1,969
To get more information on local and foreign futures markets, join us on telegram & Facebook.
Join link: https://t.me/investorsdoctoracademy
Facebook: https://m.facebook.com/investorsdoctoracademy/
Join link: https://t.me/investorsdoctoracademy
Facebook: https://m.facebook.com/investorsdoctoracademy/
9/8/2018
*US Mini Dow Jones Sep 18*
Yesterday close : 25536 -64
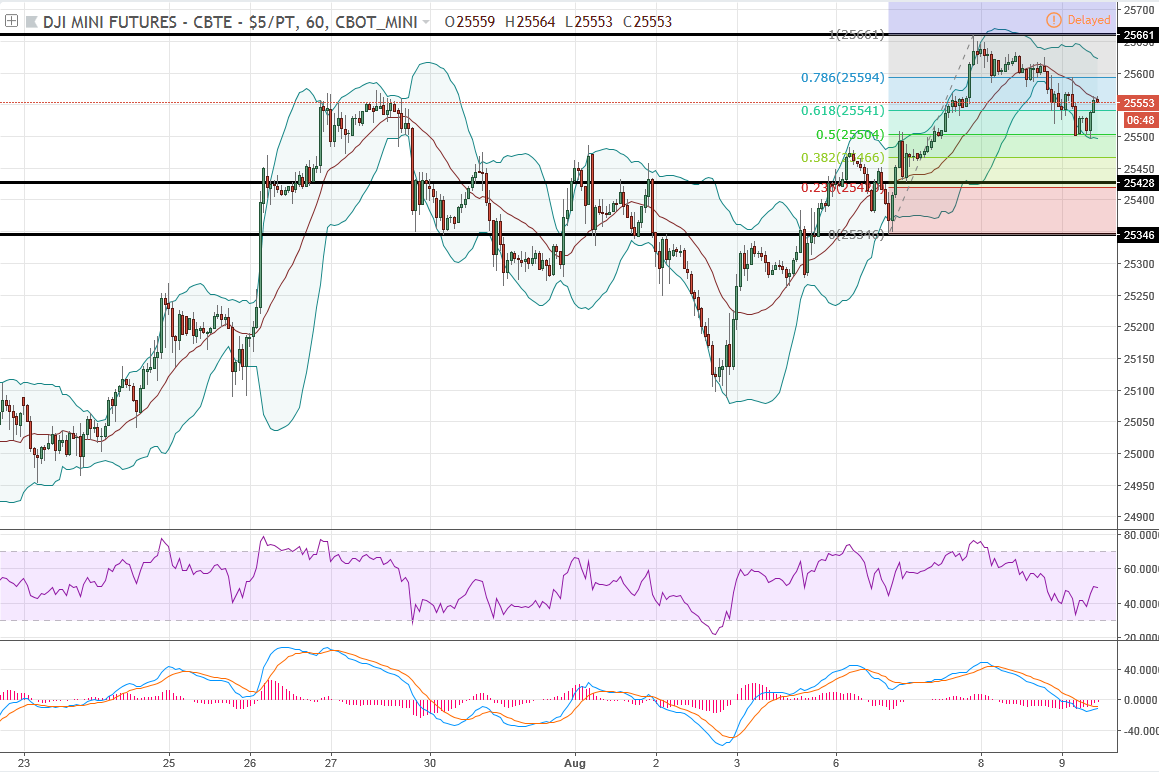
DJI retraced from 6 months high on technical selling and trade war tension. Watch out for jobless claims & PPI at 830pm tonight.
Daily chart show DJI in sideway within a large range of 23978-24564, but slightly bullish as technical indicators trending higher. Hourly chart showed DJI testing 50% Fibo retracement of previous upswing 25346-25661.
*Classic Support & Resistance*
Support: 25428 25346
Resistance: 25661 25813
*Recommended trading plan today:*
1. Look for buy signal above 25593.
2. Look for sell signal below 25495.
*Margin Requirement (per lot):*
USD 5390
Disclaimer: Idea sharing only, trade at your own risk.
Join our channels to find out more!
Telegram link:
https://t.me/investorsdoctoracademy
Facebook link: https://m.facebook.com/investorsdoctoracademy
More articles on Dow Updates
Daily Futures Commentaries: [Mini Dow Jones] 27/12/2019 - New high, year end rally continue
Created by InvestorsDoctor | Dec 27, 2019
Discussions
Be the first to like this. Showing 0 of 0 comments
Post a Comment
Featured Posts
New Update. Discover investment communities that resonate with your ideas

Apps


Top Articles
1
https://dividendguy67.blogspot.com
3
4
Good Articles to Share
Could Kamala Harris beat Donald Trump in November's presidential race?
5
Good Articles to Share
Iranian warship capsizes during repairs in port of Bandar Abbas
6
Good Articles to Share
7
Good Articles to Share
Jonathan Turley unveils exciting new book 'Free Speech in the Age of Rage'
8
Good Articles to Share
Why Impossible Foods signed hot dog-eating legend Joey Chestnut #yahoofinance #youtubeshorts
#
Stock
Score
Daily Stocks
Stock Name
Last
Change
Volume
Stock Name
Last
Change
Volume
Stock Name
Last
Change
Volume
MQ Trading Signals
Stock
Time
Signal
Duration
No trading signals available.
Stock
Time
Signal
Duration
No trading signals available.
Featured Advertisers / Partners


Ride The Bull Short The Bear
CS Tan
4.9 / 5.0
This book is the result of the author's many years of experience and observation throughout his 26 years in the stockbroking industry. It was written for general public to learn to invest based on facts and not on fantasies or hearsay....