


Dow Updates
Daily Futures Commentaries: [Mini Dow Jones] 4/7/2019 - Hit all time high, close above 27000 to confirm

InvestorsDoctor
Publish date: Thu, 04 Jul 2019, 11:38 AM
InvestorsDoctor
0 1,969
To get more information on local and foreign futures markets, join us on telegram & Facebook.
Join link: https://t.me/investorsdoctoracademy
Facebook: https://m.facebook.com/investorsdoctoracademy/
Join link: https://t.me/investorsdoctoracademy
Facebook: https://m.facebook.com/investorsdoctoracademy/
4/7/2019
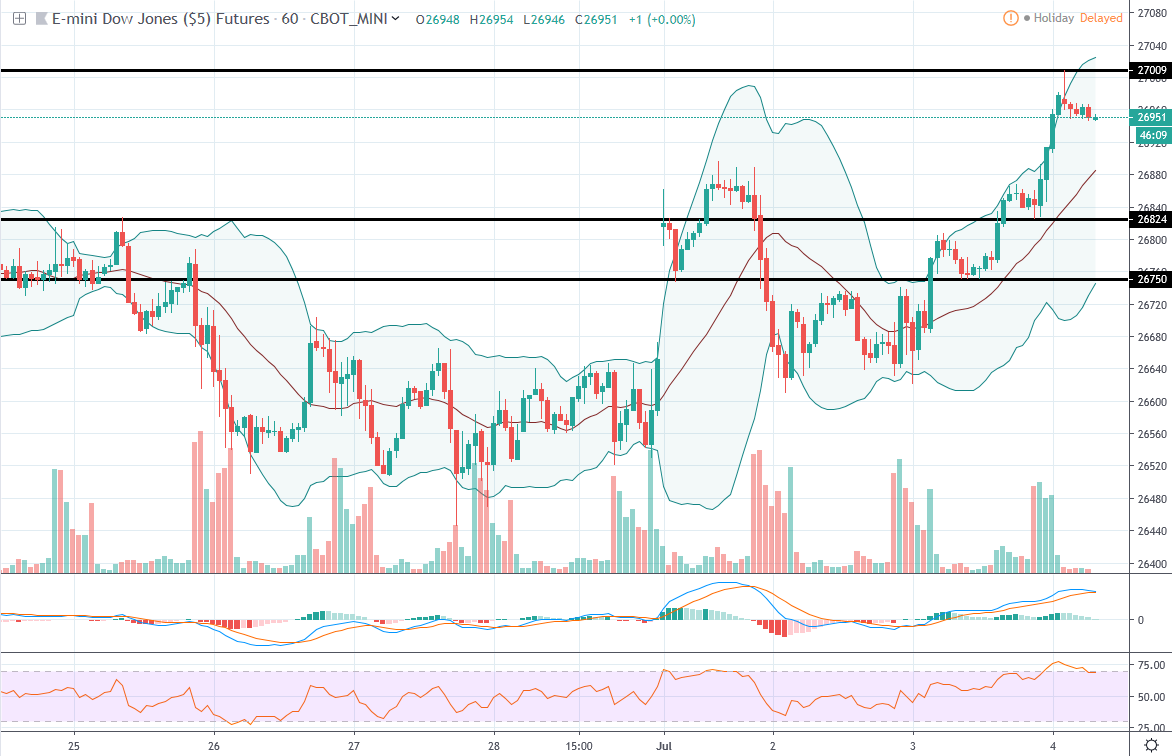
*US Mini Dow Jones Sep 19*
Yesterday close: 26970 +173
Dow Jones hit historical high to above 27000 level yesterday as expectation grew that the US Federal Reserve will cut rate this year.
Hourly chart test for a technical correction from RSI overbought with a shooting star candlestick pattern, required to close above 27000 for more upside.
*Classic Support & Resistance*
Support: 26824 26750
Resistance: 27009 27100
*Recommended trading plan today:*
1. Sell 26945 for technical correction, stop 26970, profit 26920/26895/26870
2. Look for buy signal above 27009
*Margin Requirement (per lot):*
USD 6050
Join us to discuss & trade together FKLI, FCPO, WTI Crude Oil, Comex Gold, Mini Dow Jones etc Futures markets !!!
Please SHARE & SUBSCRIBE our YOUTUBE channel for latest FREE futures trading videos !!!
https://www.youtube.com/channel/UCnOB_UmIXe3OTE2SgiK9kpg
Join our FREE channels to find out more on futures trading !!!
Telegram link:
https://t.me/investorsdoctoracademy
Facebook link:
https://www.facebook.com/investorsdoctoracademy
Or reach out to our contact number IDA Investors Doctor Academy
+601153537589
More articles on Dow Updates
Daily Futures Commentaries: [Mini Dow Jones] 27/12/2019 - New high, year end rally continue
Created by InvestorsDoctor | Dec 27, 2019
Discussions
Be the first to like this. Showing 0 of 0 comments
Post a Comment
Featured Posts


Apps


Top Articles
1
https://dividendguy67.blogspot.com
3
4
Good Articles to Share
Could Kamala Harris beat Donald Trump in November's presidential race?
5
Good Articles to Share
Iranian warship capsizes during repairs in port of Bandar Abbas
6
Good Articles to Share
7
Good Articles to Share
Jonathan Turley unveils exciting new book 'Free Speech in the Age of Rage'
8
Good Articles to Share
Why Impossible Foods signed hot dog-eating legend Joey Chestnut #yahoofinance #youtubeshorts
#
Stock
Score
Daily Stocks
Stock Name
Last
Change
Volume
Stock Name
Last
Change
Volume
Stock Name
Last
Change
Volume
MQ Trading Signals
Stock
Time
Signal
Duration
No trading signals available.
Stock
Time
Signal
Duration
No trading signals available.
Featured Advertisers / Partners


Ride The Bull Short The Bear
CS Tan
4.9 / 5.0
This book is the result of the author's many years of experience and observation throughout his 26 years in the stockbroking industry. It was written for general public to learn to invest based on facts and not on fantasies or hearsay....