


KLCI waves
KLCI waves 24 - Is Wave C there yet ?

hotstock1975
Publish date: Mon, 14 Sep 2020, 12:55 AM
hotstock1975
0 101
Elliot wave analysis to measure price behavior for projecting next price actions
Weekly Time Frame
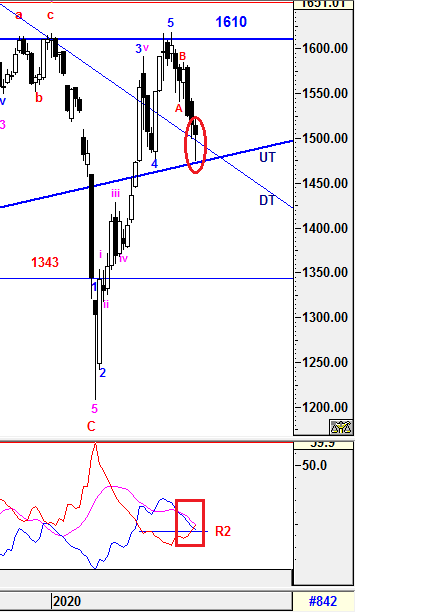
KLCI was able to bounce up and closed above DT line after tested UT line at around 1475. The reaction had created an bullish hammer formation with high volume. Therefore, a trend reversal could emerged if KLCI manage to breach and close above 1515 convincingly on this coming Friday. Otherwise, caution is still remained until further signal to justify any potential of trend reversal.
On the other hand, the higher degree of correction will be elaborated further in daily time frame.
1) -DMI (red line) continue heading up and broke out above resistance at point R2 indicates bearish momentum is intensify.
2) +DMI (blue line) continue heading down with greater margin indicates bull strenght is continuing decrease.
3) ADX (pink line) is still curving down with greater margin which implying the volatility of the current Bear trend is still uncertain and weak.
Therefore, the summations of the 3 signals above is implying uncertainty still remains and knee jerk reaction is unavoidable as expected.
As mentioned from prior session, +DMI had crossed below -DMI after selling pressure continued. However, it does not mean that bear trend is taking positions from here right away as ADX is still indicating weakness in volitality of the momentum unless ADX start to curve up.
Prevailing trend could be emerged if levels listed below was broken:
Resistance - 1610
Immediate Resistance - 1515, 1525, 1545
Immediate Support - 1485 (DT line)
Support - 1475 (UT line)
Daily Time Frame
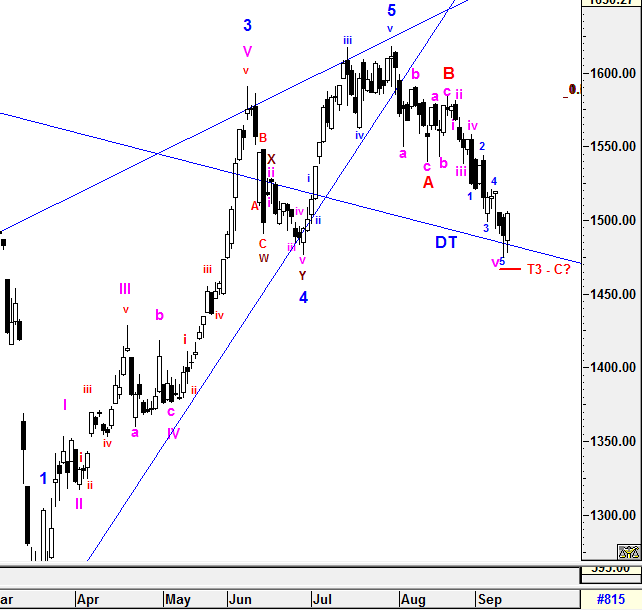
To recap from prior session, KLCI could test 3rd target levels (T3) 1457.85 - 1465 (around 1.618% of wave A) if 1498.72 was broken and the extension waves formed would be revised on the entire 5 sub minutte waves.
Since the level had been breached, the extension of the entire 5 sub minutte waves have been revised as the extension should incur at 5th instead of 3rd sub minutte wave as labelled above.
If the extension of 5th sub minutte wave ended at 1474.23 which was 9 points away from (T3), no doubt that wave C should be realized conjuntionally.
In order to validate wave C end, KLCI have to trade and close above 1506 in short run convincingly. If it does, Bullish Engulfing Formation will be valid which could spur a stronger momentum towards upside bias and a new set of wave counts could be bias to Bull in short run at least.
.
However, the entire correction structure will be monitored closely as wave C has the most properties of wave forms which may lead to complexity formations.
All waves' count and projected target are generated based on past/current price level and it may be subjected to vary if degree of momentum movement change.
Prevailing trend could be emerged if levels listed below was broken:
Resistance - 1610
Immediate resistance - 1520, 1535
Immediate support - 1485 (DT line)
Support - 1475 (UT line)
Let's Mr Market pave the waves.
Trade safely
Wave Believer
More articles on KLCI waves
KLCI waves 94 - WILL THE DOWNWARD PRESSURE TO BE IMPULSIVE TOWARDS WAVE E?
Created by hotstock1975 | Jan 24, 2022
KLCI waves 93 - EXTENSION UPWARD ENDED AND IT'S TIME TO THE DOWNSIDE?
Created by hotstock1975 | Jan 17, 2022
KLCI waves 89 - KLCI WILL EXTEND AND HIT LOWER TARGETS GRADUALLY
Created by hotstock1975 | Dec 20, 2021
Discussions
Be the first to like this. Showing 0 of 0 comments
Post a Comment
Featured Posts


Latest Videos


Apps


Top Articles
1
2
3
Koon Yew Yin's Blog
4
THE INVESTMENT APPROACH OF CALVIN TAN
5
save malaysia!
7
8
CEO Morning Brief
#
Stock
Score
Daily Stocks
Stock Name
Last
Change
Volume
Stock Name
Last
Change
Volume
MQ Trading Signals
Stock
Time
Signal
Duration
Stock
Time
Signal
Duration
Featured Advertisers / Partners


Ride The Bull Short The Bear
CS Tan
4.9 / 5.0
This book is the result of the author's many years of experience and observation throughout his 26 years in the stockbroking industry. It was written for general public to learn to invest based on facts and not on fantasies or hearsay....