


FKLI Updates
[KLCI Futures] - Slight Correction, Price Trend Remain Strong

InvestorsDoctor
Publish date: Wed, 10 Jan 2018, 08:45 AM
InvestorsDoctor
0 1,969
Here we update timely info about FKLI
To get more information on local and foreign futures markets, u can join us at telegram and Facebook.
Join link: https://t.me/investorsdoctoracademy
Facebook: https://m.facebook.com/investorsdoctoracademy/
To get more information on local and foreign futures markets, u can join us at telegram and Facebook.
Join link: https://t.me/investorsdoctoracademy
Facebook: https://m.facebook.com/investorsdoctoracademy/
10/1/2018
FKLI Jan 18
Previous Close: 1827.5 -10.5
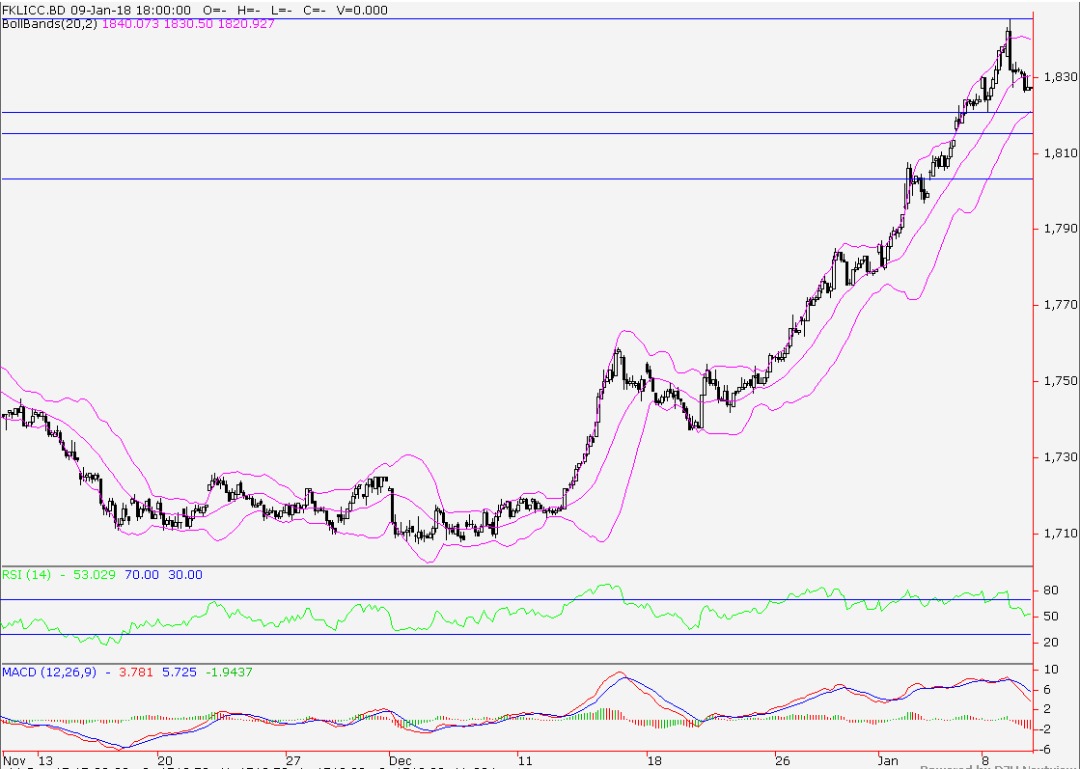
KLCI stock market yesterday show losers outperformed gainers for the 1st time after nearly 3 consecutive weeks of gains, but foreign fund remains net buyer, expected that market take a pause before continue its bull rally. US market recorded another all time high, may push up FKLI later.
Daily chart's RSI in overbought, may enter a short term correction. From smaller time frame, break below 1821 likely to trigger a head & shoulder down signal. Technical indicators show FKLI may continue to test support, overall trend remain bullish with possible short term correction.
Price Level to monitor today:
Resistance : 1845.5 1860
Support : 1821 1815.5
Recommend Trading Plan for the day:
1. Look for rebound buy signal if break above 1834.
2. Sell lower low 1825.5, stop 1831, profit 1820.
FKLI Margin Requirement
Intraday MYR 1750
Overnight MYR 3500
Spread MYR 500
Disclaimer: Idea for sharing purpose, trade at your own risk.
To get more information on local and foreign futures markets, join us on telegram & Facebook.
Join link: https://t.me/investorsdoctoracademy
Facebook: https://m.facebook.com/investorsdoctoracademy/
More articles on FKLI Updates
Daily Futures Commentaries: [FKLI Malaysia Index] 30/12/2019 - 1595 or 1620 wait for breakout
Created by InvestorsDoctor | Dec 30, 2019
Discussions
Be the first to like this. Showing 0 of 0 comments
Post a Comment
Featured Posts
New Update. Discover investment communities that resonate with your ideas

Apps


Top Articles
1
https://dividendguy67.blogspot.com
2
3
4
6
Good Articles to Share
Hamas accepts US proposal on talks over Israeli hostages, Hamas source says
7
Good Articles to Share
Could Kamala Harris beat Donald Trump in November's presidential race?
8
Good Articles to Share
Fire breaks out after accident at gas pipeline in Crimea, Russian officials say
#
Stock
Score
Daily Stocks
Stock Name
Last
Change
Volume
Stock Name
Last
Change
Volume
Stock Name
Last
Change
Volume
MQ Trading Signals
Stock
Time
Signal
Duration
No trading signals available.
Stock
Time
Signal
Duration
No trading signals available.
Featured Advertisers / Partners


Ride The Bull Short The Bear
CS Tan
4.9 / 5.0
This book is the result of the author's many years of experience and observation throughout his 26 years in the stockbroking industry. It was written for general public to learn to invest based on facts and not on fantasies or hearsay....