


FKLI Updates
[KLCI Futures] - Price Trading in Range, Waiting for Breakout

InvestorsDoctor
Publish date: Mon, 22 Jan 2018, 08:19 AM
InvestorsDoctor
0 1,969
Here we update timely info about FKLI
To get more information on local and foreign futures markets, u can join us at telegram and Facebook.
Join link: https://t.me/investorsdoctoracademy
Facebook: https://m.facebook.com/investorsdoctoracademy/
To get more information on local and foreign futures markets, u can join us at telegram and Facebook.
Join link: https://t.me/investorsdoctoracademy
Facebook: https://m.facebook.com/investorsdoctoracademy/
22/1/2018
FKLI Jan 18
Previous Close: 1833
FKLI finished higher and expected to start the week on a positive note with sustained momentum from last Friday. World equity markets climbed to a record on Friday as the U.S. dollar held near three-year lows and a U.S. government shutdown loomed, while U.S. Treasury yields continued their ascent to hit their highest levels since September 2014, according to Reuters.
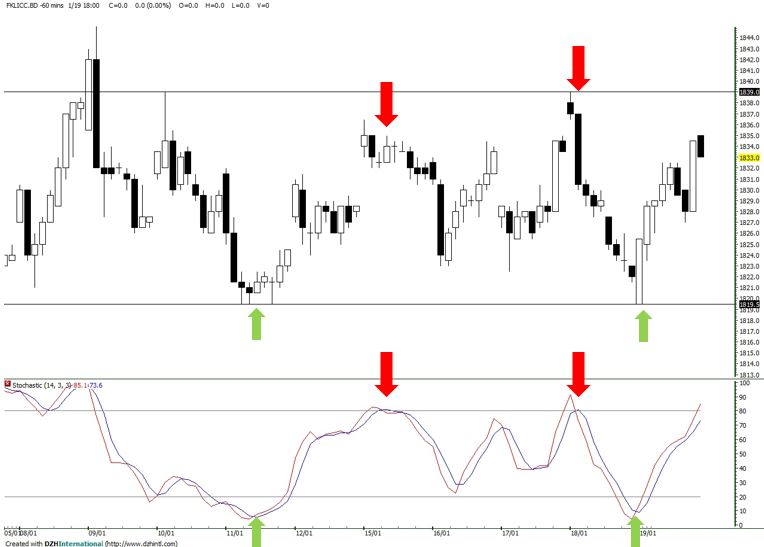
In the Daily chart, FKLI trading in the range for 1819 to 1839 for the past 10 trading days. Despite a good momentum on last Friday, FKLI has yet to breakout the range and market remained in sideway. While trader can initial entry when breakout. Daily Average True Range climbed to 14.
Price Level to monitor today:
Resistance : 1839
Support : 1819.5
Recommend Trading Plan for the day:
1. Look for sell signal if break below 1819, stop 1825, TP 1813
2. Look for buy signal if break above 1839.5, stop 1829.5, TP 1849.5 & 1859.5
3. Range Trader may initiate trades if market trading between 1839 to 1819, buy near 1819, sell near 1839, take 8 points stop with 8 points TP. Alternatively, follow hourly stochatisc crossover in overbought zone for sell and crossover in oversold zone for buy. Stop and TP follow 2 hourly ATR.
Events to Watch This Week:
Wed 12:00 pm Yearly Inflation
Thu 03:00 pm Interest Rate Decision
FKLI Margin Requirement
Intraday MYR 1750
Overnight MYR 3500
Spread MYR 500
Disclaimer: Idea for sharing purpose, trade at your own risk.
To get more information on local and foreign futures markets, join us on telegram & Facebook.
Join link: https://t.me/investorsdoctoracademy
Facebook: https://m.facebook.com/investorsdoctoracademy/
More articles on FKLI Updates
Daily Futures Commentaries: [FKLI Malaysia Index] 30/12/2019 - 1595 or 1620 wait for breakout
Created by InvestorsDoctor | Dec 30, 2019
Discussions
Be the first to like this. Showing 0 of 0 comments
Post a Comment
Featured Posts
New Update. Discover investment communities that resonate with your ideas

Apps


Top Articles
1
https://dividendguy67.blogspot.com
2
3
4
6
Good Articles to Share
7
Good Articles to Share
Sydney house fire kills three children, police suspect homicide
8
Good Articles to Share
#
Stock
Score
Daily Stocks
Stock Name
Last
Change
Volume
Stock Name
Last
Change
Volume
Stock Name
Last
Change
Volume
MQ Trading Signals
Stock
Time
Signal
Duration
No trading signals available.
Stock
Time
Signal
Duration
No trading signals available.
Featured Advertisers / Partners


Ride The Bull Short The Bear
CS Tan
4.9 / 5.0
This book is the result of the author's many years of experience and observation throughout his 26 years in the stockbroking industry. It was written for general public to learn to invest based on facts and not on fantasies or hearsay....