


FKLI Updates
Daily Futures Commentaries: [FKLI Malaysia Index] 19/9/2018 - DJI strong rebound likely to push FKLI to retest 1800

InvestorsDoctor
Publish date: Wed, 19 Sep 2018, 08:42 AM
InvestorsDoctor
0 1,969
Here we update timely info about FKLI
To get more information on local and foreign futures markets, u can join us at telegram and Facebook.
Join link: https://t.me/investorsdoctoracademy
Facebook: https://m.facebook.com/investorsdoctoracademy/
To get more information on local and foreign futures markets, u can join us at telegram and Facebook.
Join link: https://t.me/investorsdoctoracademy
Facebook: https://m.facebook.com/investorsdoctoracademy/
19/9/2018
*FKLI Sep 18*
Previous Close: 1791.5 -6.5
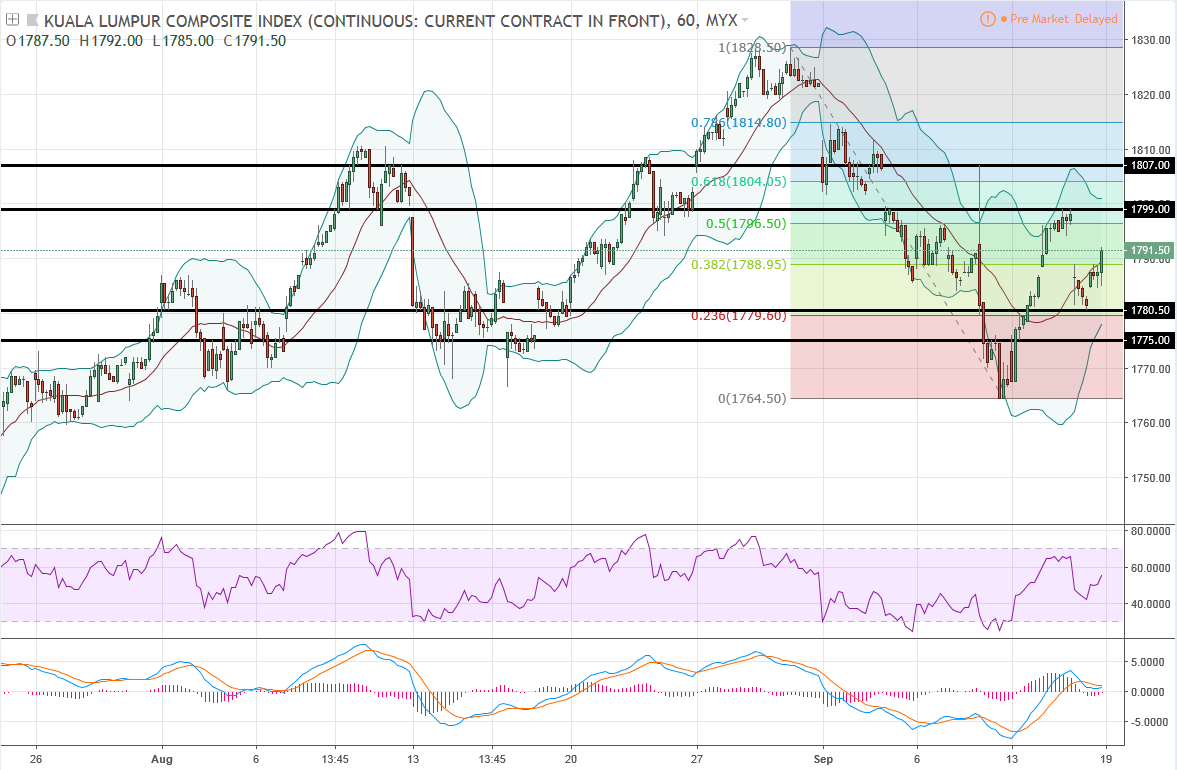
FKLI faced pressure of US-China trade war tensions & foreign fund selling, ended below 1800. US stock market strongly rebounded for more than 180pts, FKLI likely gap up and retest 1800 level.
Daily chart showed FKLI in a sideway range and testing middle line of BB, wait for breakout, while hourly chart showed FKLI testing 38.2 Fibo level of swing 1828.5-1764.5, below 61.8% pointed more to downside.
*Classic Support & Resistance*
Resistance: 1799 1807
Support: 1780.5 1775
*Recommend Trading Plan for the day:*
1. Look for buy signal above 1799.
*FKLI Margin Requirement*
Overnight MYR 4000
Spread MYR 500
Disclaimer: Idea sharing only, trade at your own risk.
Join our channels to find out more!
Telegram link:
https://t.me/investorsdoctoracademy
Facebook link: https://m.facebook.com/investorsdoctoracademy
More articles on FKLI Updates
Daily Futures Commentaries: [FKLI Malaysia Index] 30/12/2019 - 1595 or 1620 wait for breakout
Created by InvestorsDoctor | Dec 30, 2019
Discussions
Be the first to like this. Showing 0 of 0 comments
Post a Comment
Featured Posts


Apps


Top Articles
1
https://dividendguy67.blogspot.com
2
3
4
6
Good Articles to Share
7
Good Articles to Share
Sydney house fire kills three children, police suspect homicide
8
Good Articles to Share
#
Stock
Score
Daily Stocks
Stock Name
Last
Change
Volume
Stock Name
Last
Change
Volume
Stock Name
Last
Change
Volume
MQ Trading Signals
Stock
Time
Signal
Duration
No trading signals available.
Stock
Time
Signal
Duration
No trading signals available.
Featured Advertisers / Partners


Ride The Bull Short The Bear
CS Tan
4.9 / 5.0
This book is the result of the author's many years of experience and observation throughout his 26 years in the stockbroking industry. It was written for general public to learn to invest based on facts and not on fantasies or hearsay....