


FKLI Updates
Daily Futures Commentaries: [FKLI Malaysia Index] 15/10/2018 - Global stock market continue to rebound, FKLI likely to follow

InvestorsDoctor
Publish date: Mon, 15 Oct 2018, 08:35 AM
InvestorsDoctor
0 1,969
Here we update timely info about FKLI
To get more information on local and foreign futures markets, u can join us at telegram and Facebook.
Join link: https://t.me/investorsdoctoracademy
Facebook: https://m.facebook.com/investorsdoctoracademy/
To get more information on local and foreign futures markets, u can join us at telegram and Facebook.
Join link: https://t.me/investorsdoctoracademy
Facebook: https://m.facebook.com/investorsdoctoracademy/
15/10/2018
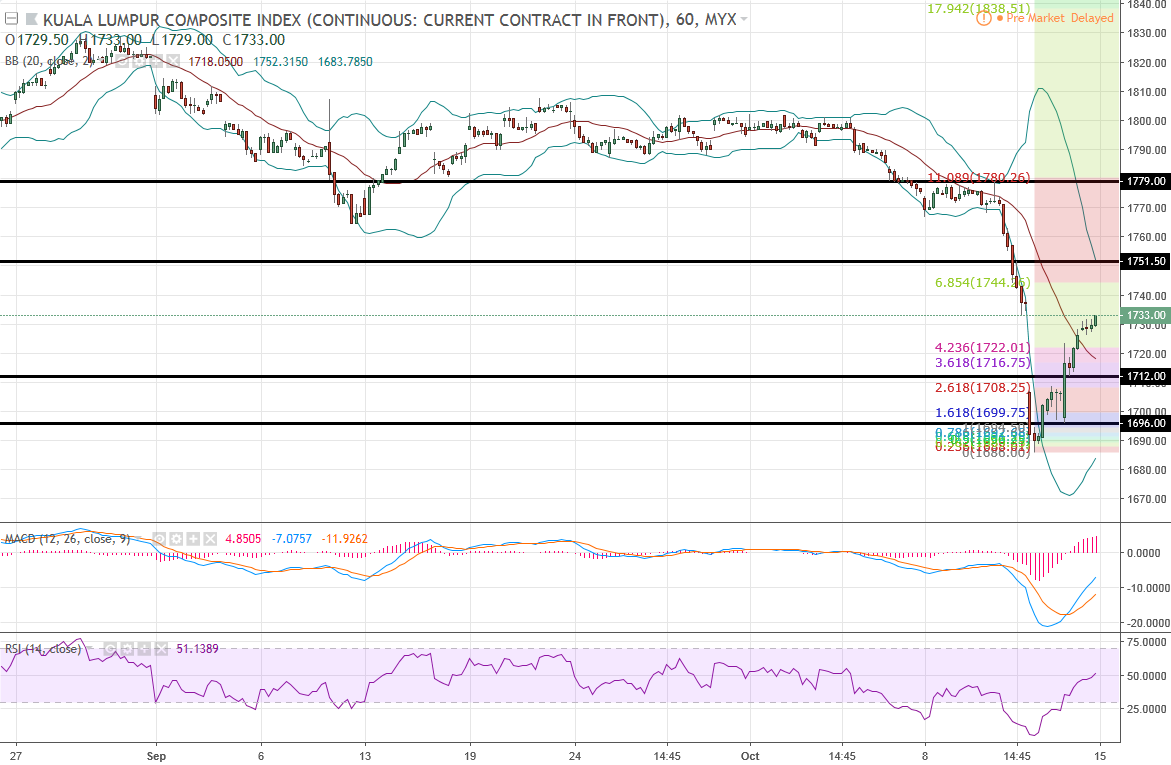
*FKLI Oct 18*
Previous Close: 1733 +27
FKLI rebounded from 3 month low as tracking recovery in global stock markets. US stock market up near 300pts last Friday, FKLI may gap up and test resistance. Watch out for Msia unemployment rate on12pm today.
A green candle above previous doji in daily chart form a technical rebound signal, testing to close upside gap, plus hourly chart's technical indicators crossing up, FKLI likely to continue test rebound.
*Classic Support & Resistance*
Resistance: 1751.5 1779
Support: 1712 1696
*Recommend Trading Plan for the day:*
1. Buy 1734 for technical rebound, stop 1729, profit 1739/1744.
*FKLI Margin Requirement*
Overnight MYR 4000
Spread MYR 500
Disclaimer: Idea sharing only, trade at your own risk.
Join our channels to find out more!
Telegram link:
https://t.me/investorsdoctoracademy
Facebook link: https://m.facebook.com/investorsdoctoracademy
More articles on FKLI Updates
Daily Futures Commentaries: [FKLI Malaysia Index] 30/12/2019 - 1595 or 1620 wait for breakout
Created by InvestorsDoctor | Dec 30, 2019
Discussions
Be the first to like this. Showing 0 of 0 comments
Post a Comment
Featured Posts
New Update. Discover investment communities that resonate with your ideas

Apps


Top Articles
1
https://dividendguy67.blogspot.com
2
3
4
6
Good Articles to Share
Hamas accepts US proposal on talks over Israeli hostages, Hamas source says
7
Good Articles to Share
Could Kamala Harris beat Donald Trump in November's presidential race?
8
Good Articles to Share
Fire breaks out after accident at gas pipeline in Crimea, Russian officials say
#
Stock
Score
Daily Stocks
Stock Name
Last
Change
Volume
Stock Name
Last
Change
Volume
Stock Name
Last
Change
Volume
MQ Trading Signals
Stock
Time
Signal
Duration
No trading signals available.
Stock
Time
Signal
Duration
No trading signals available.
Featured Advertisers / Partners


Ride The Bull Short The Bear
CS Tan
4.9 / 5.0
This book is the result of the author's many years of experience and observation throughout his 26 years in the stockbroking industry. It was written for general public to learn to invest based on facts and not on fantasies or hearsay....