


FKLI Updates
Daily Futures Commentaries: [FKLI Malaysia Index] 11/2/2019 - Likely enter sideway, trade in range

InvestorsDoctor
Publish date: Mon, 11 Feb 2019, 08:33 AM
InvestorsDoctor
0 1,969
Here we update timely info about FKLI
To get more information on local and foreign futures markets, u can join us at telegram and Facebook.
Join link: https://t.me/investorsdoctoracademy
Facebook: https://m.facebook.com/investorsdoctoracademy/
To get more information on local and foreign futures markets, u can join us at telegram and Facebook.
Join link: https://t.me/investorsdoctoracademy
Facebook: https://m.facebook.com/investorsdoctoracademy/
11/2/2019
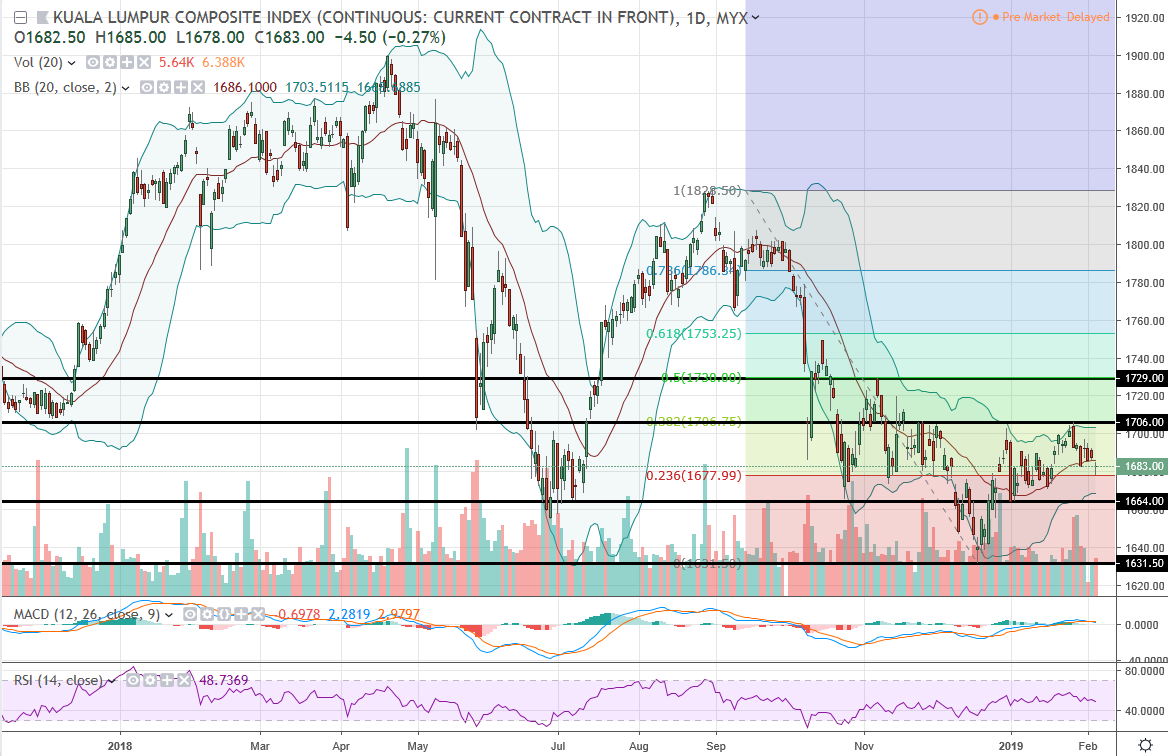
*FKLI Feb 19*
Previous Close: 1683 -4.5
FKLI unable to sustain above 1700 level during last week while US stock market drop slightly on last Friday, FKLI may test support 1st.
Daily chart showed FKLI entered a sideway with technical indicators in neutral, traders may choose to trade within the BB which is from around 1660-1710.
*Classic Support & Resistance*
Resistance: 1706 1729
Support: 1664 1631.5
*Recommend Trading Plan for the day:*
1. Look for sell signal below 1678.
*FKLI Margin Requirement*
Overnight MYR 5000
Spread MYR 500
Disclaimer: Idea sharing only, trade at your own risk.
Please SHARE & SUBSCRIBE our YOUTUBE channel for latest FREE futures trading videos !!!
https://www.youtube.com/channel/UCnOB_UmIXe3OTE2SgiK9kpg
Join our FREE channels to find out more on futures trading !!!
Telegram link:
https://t.me/investorsdoctoracademy
Facebook link:
https://m.facebook.com/investorsdoctoracademy
Or reach out to our contact number +601153537589


More articles on FKLI Updates
Daily Futures Commentaries: [FKLI Malaysia Index] 30/12/2019 - 1595 or 1620 wait for breakout
Created by InvestorsDoctor | Dec 30, 2019
Discussions
Be the first to like this. Showing 0 of 0 comments
Post a Comment
Featured Posts
New Update. Discover investment communities that resonate with your ideas

Apps


Top Articles
1
https://dividendguy67.blogspot.com
2
3
4
6
Good Articles to Share
Hamas accepts US proposal on talks over Israeli hostages, Hamas source says
7
Good Articles to Share
Could Kamala Harris beat Donald Trump in November's presidential race?
8
Good Articles to Share
Fire breaks out after accident at gas pipeline in Crimea, Russian officials say
#
Stock
Score
Daily Stocks
Stock Name
Last
Change
Volume
Stock Name
Last
Change
Volume
Stock Name
Last
Change
Volume
MQ Trading Signals
Stock
Time
Signal
Duration
No trading signals available.
Stock
Time
Signal
Duration
No trading signals available.
Featured Advertisers / Partners


Ride The Bull Short The Bear
CS Tan
4.9 / 5.0
This book is the result of the author's many years of experience and observation throughout his 26 years in the stockbroking industry. It was written for general public to learn to invest based on facts and not on fantasies or hearsay....