


FKLI Updates
Daily Futures Commentaries: [FKLI Malaysia Index] 21/2/2019 - Bullish signal, watch out for next Fibo price level

InvestorsDoctor
Publish date: Thu, 21 Feb 2019, 08:26 AM
InvestorsDoctor
0 1,969
Here we update timely info about FKLI
To get more information on local and foreign futures markets, u can join us at telegram and Facebook.
Join link: https://t.me/investorsdoctoracademy
Facebook: https://m.facebook.com/investorsdoctoracademy/
To get more information on local and foreign futures markets, u can join us at telegram and Facebook.
Join link: https://t.me/investorsdoctoracademy
Facebook: https://m.facebook.com/investorsdoctoracademy/
22/2/2019
*FKLI Feb 19*
Previous Close: 1727 +19.5
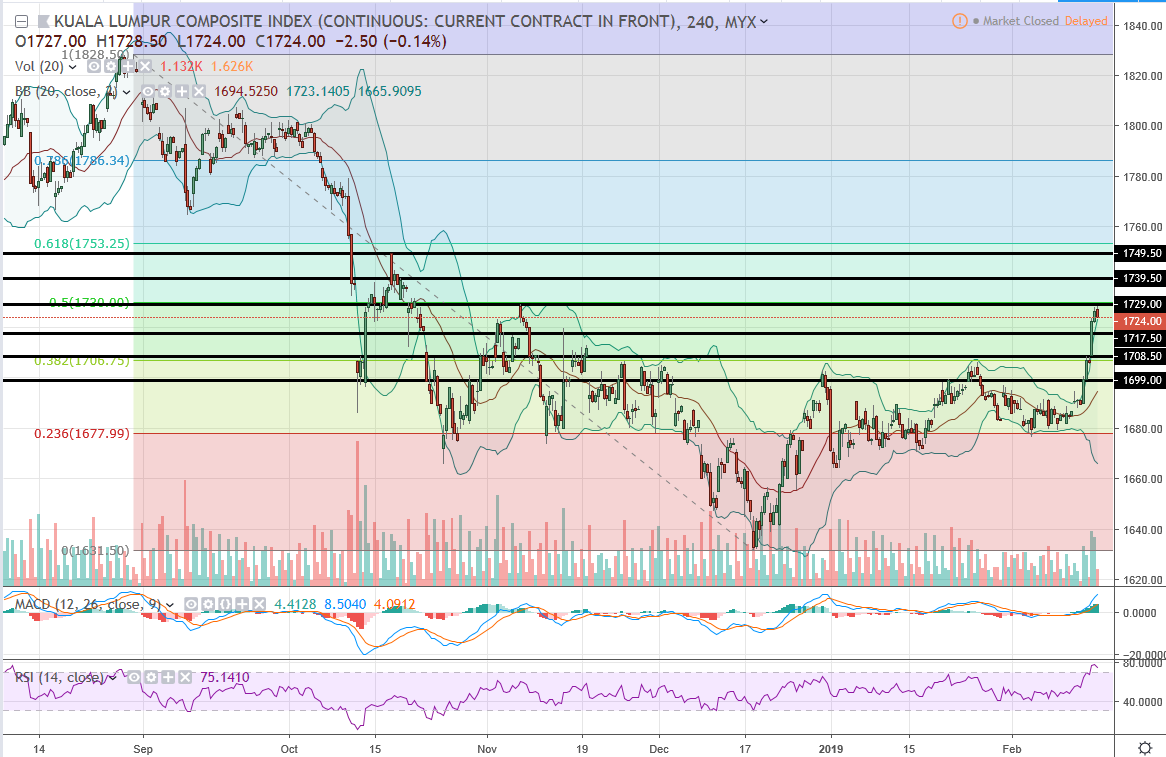
FKLI hit more than 3 months high as led by strong rebound in index stocks. US stock market up more than 60pts last night, FKLI likely continue its rebound stage.
Daily chart formed 2nd long white candle, marked a bullish momentum yo test immediate previous high at 1729, which is also 50% Fibo retracement level of swing 1828.5-1631.5. 4H chart's BB expanding upside while RSI & MACD crossing up, more to bullish, but be cautious as RSI in overbought, may see some profit taking before it going higher.
*Classic Support & Resistance*
Resistance: 1729 1739.5 1749.5
Support: 1717.5 1708.5 1699
*Recommend Trading Plan for the day:*
1. Look for buy signal above 1730.
*FKLI Margin Requirement*
Overnight MYR 4000
Spread MYR 500
Disclaimer: Idea sharing only, trade at your own risk.
Please SHARE & SUBSCRIBE our YOUTUBE channel for latest FREE futures trading videos !!!
https://www.youtube.com/channel/UCnOB_UmIXe3OTE2SgiK9kpg
Join our FREE channels to find out more on futures trading !!!
Telegram link:
https://t.me/investorsdoctoracademy
Facebook link:
https://m.facebook.com/investorsdoctoracademy
Or reach out to our contact number +601153537589
More articles on FKLI Updates
Daily Futures Commentaries: [FKLI Malaysia Index] 30/12/2019 - 1595 or 1620 wait for breakout
Created by InvestorsDoctor | Dec 30, 2019
Discussions
Be the first to like this. Showing 0 of 0 comments
Post a Comment
Featured Posts
New Update. Discover investment communities that resonate with your ideas

Apps


Top Articles
1
https://dividendguy67.blogspot.com
2
3
4
6
Good Articles to Share
7
Good Articles to Share
Sydney house fire kills three children, police suspect homicide
8
Good Articles to Share
#
Stock
Score
Daily Stocks
Stock Name
Last
Change
Volume
Stock Name
Last
Change
Volume
Stock Name
Last
Change
Volume
MQ Trading Signals
Stock
Time
Signal
Duration
No trading signals available.
Stock
Time
Signal
Duration
No trading signals available.
Featured Advertisers / Partners


Ride The Bull Short The Bear
CS Tan
4.9 / 5.0
This book is the result of the author's many years of experience and observation throughout his 26 years in the stockbroking industry. It was written for general public to learn to invest based on facts and not on fantasies or hearsay....