


FKLI Updates
Daily Futures Commentaries: [FKLI Malaysia Index] 22/3/2019 - Sharp fall yesterday, below 1656 for more downside, watch out technical rebound

InvestorsDoctor
Publish date: Fri, 22 Mar 2019, 08:38 AM
InvestorsDoctor
0 1,969
Here we update timely info about FKLI
To get more information on local and foreign futures markets, u can join us at telegram and Facebook.
Join link: https://t.me/investorsdoctoracademy
Facebook: https://m.facebook.com/investorsdoctoracademy/
To get more information on local and foreign futures markets, u can join us at telegram and Facebook.
Join link: https://t.me/investorsdoctoracademy
Facebook: https://m.facebook.com/investorsdoctoracademy/
22/3/2019
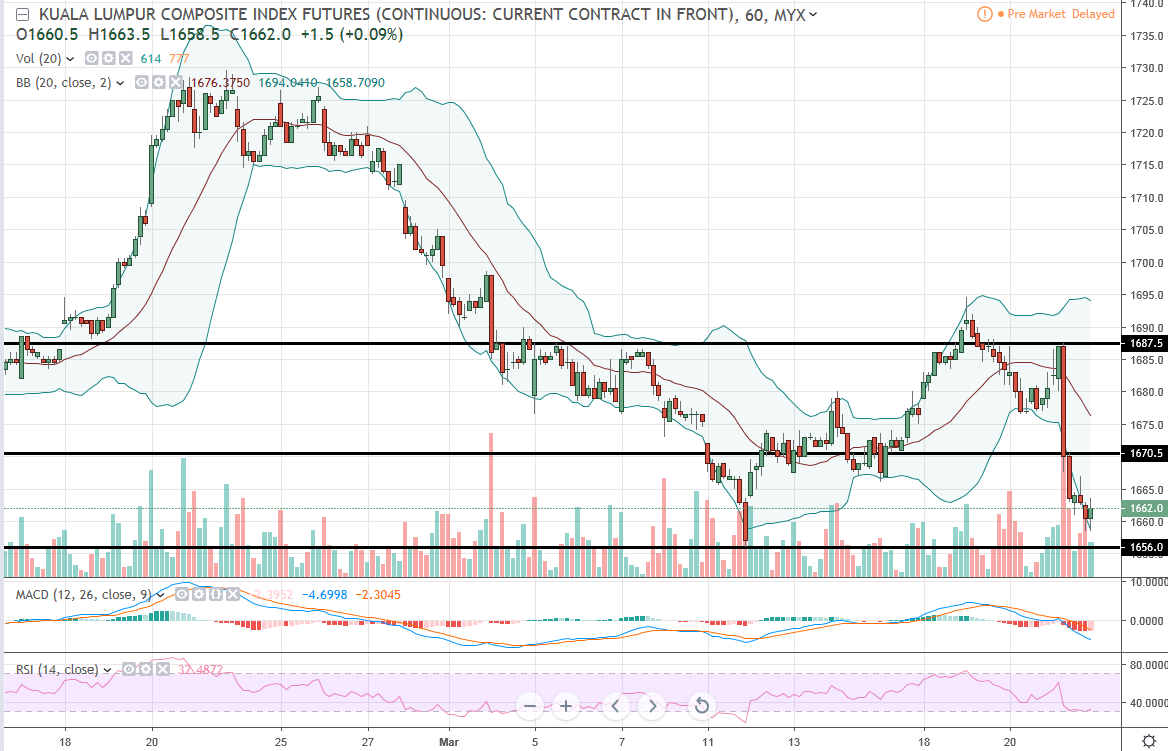
*FKLI Mar 19*
Previous Close: 1662 -19
FKLI plunged to near 2 week low as dragged down by mainly banking stocks on worries of windfall tax. However, foreign fund remain as net buyer and US stock market recovered more than 200pts yesterday, FKLI may gap up and test rebound 1st.
Daily chart testing to form H&S bearish signal, close below 1656 to trigger more downside, while hourly chartalso showed a bearish signal with long black candle, watch out as RSI approaching oversold, may trigger technical rebound in short term.
*Classic Support & Resistance*
Resistance: 1670.5 1687.5
Support: 1656 1641
*Recommend Trading Plan for the day*
1. Buy 1664 for technical rebound, stop 1659, profit 1669/1674/1679.
2. Sell 1655, stop 1658, profit 1652/1649/1646.
*FKLI Margin Requirement*
Overnight MYR 4000
Spread MYR 500
Disclaimer: Idea sharing only, trade at your own risk.
Please SHARE & SUBSCRIBE our YOUTUBE channel for latest FREE futures trading videos !!!
https://www.youtube.com/channel/UCnOB_UmIXe3OTE2SgiK9kpg
Join our FREE channels to find out more on futures trading !!!
Telegram link:
https://t.me/investorsdoctoracademy
Facebook link:
https://m.facebook.com/investorsdoctoracademy
Or reach out to our contact number +601153537589
More articles on FKLI Updates
Daily Futures Commentaries: [FKLI Malaysia Index] 30/12/2019 - 1595 or 1620 wait for breakout
Created by InvestorsDoctor | Dec 30, 2019
Discussions
Be the first to like this. Showing 0 of 0 comments
Post a Comment
Featured Posts


Apps


Top Articles
1
https://dividendguy67.blogspot.com
2
3
4
6
Good Articles to Share
Hamas accepts US proposal on talks over Israeli hostages, Hamas source says
7
Good Articles to Share
Could Kamala Harris beat Donald Trump in November's presidential race?
8
Good Articles to Share
Fire breaks out after accident at gas pipeline in Crimea, Russian officials say
#
Stock
Score
Daily Stocks
Stock Name
Last
Change
Volume
Stock Name
Last
Change
Volume
Stock Name
Last
Change
Volume
MQ Trading Signals
Stock
Time
Signal
Duration
No trading signals available.
Stock
Time
Signal
Duration
No trading signals available.
Featured Advertisers / Partners


Ride The Bull Short The Bear
CS Tan
4.9 / 5.0
This book is the result of the author's many years of experience and observation throughout his 26 years in the stockbroking industry. It was written for general public to learn to invest based on facts and not on fantasies or hearsay....