Price/Earning-to-Growth (PEG) Ratio (PEG比率)
YOLO123
Publish date: Thu, 24 Dec 2020, 07:55 PM

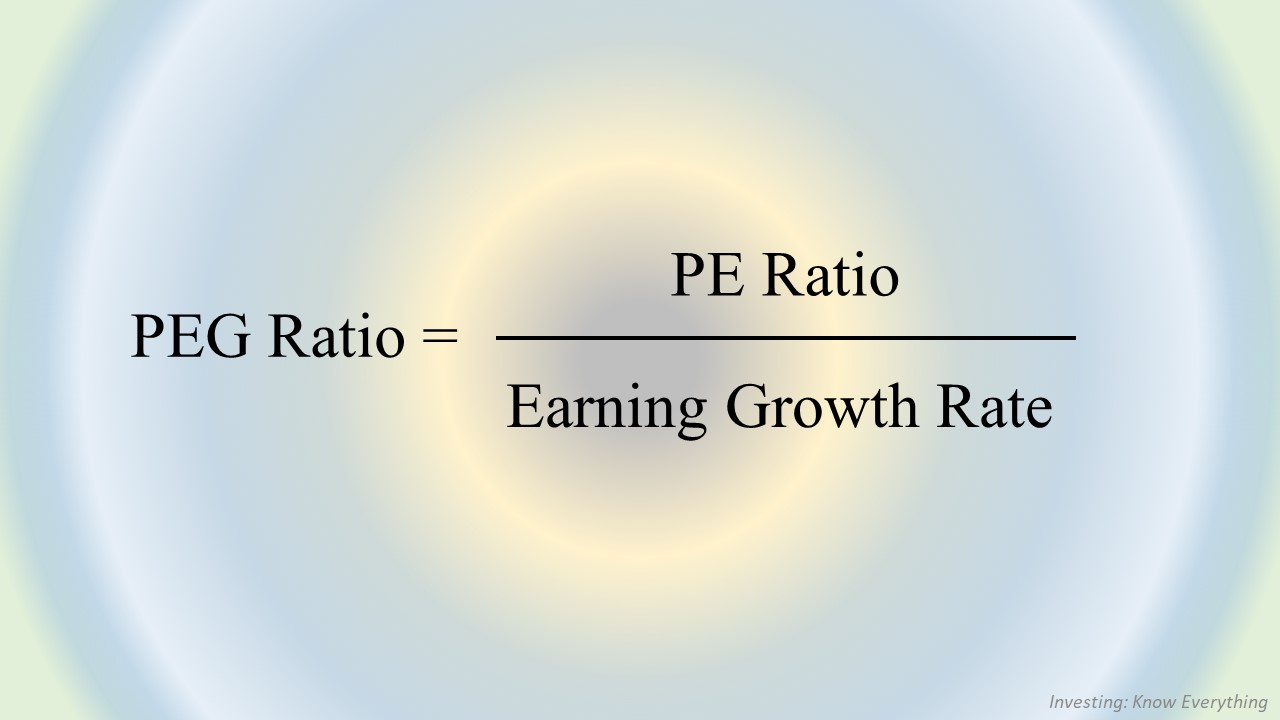
PEG ratio is an improvement from PE ratio, as it included expected earning growth into the calculation. Same goes to PEG ratio, where a higher PEG ratio means the stock is overvalued, and a lower PEG ratio indicates that the stock is undervalued.
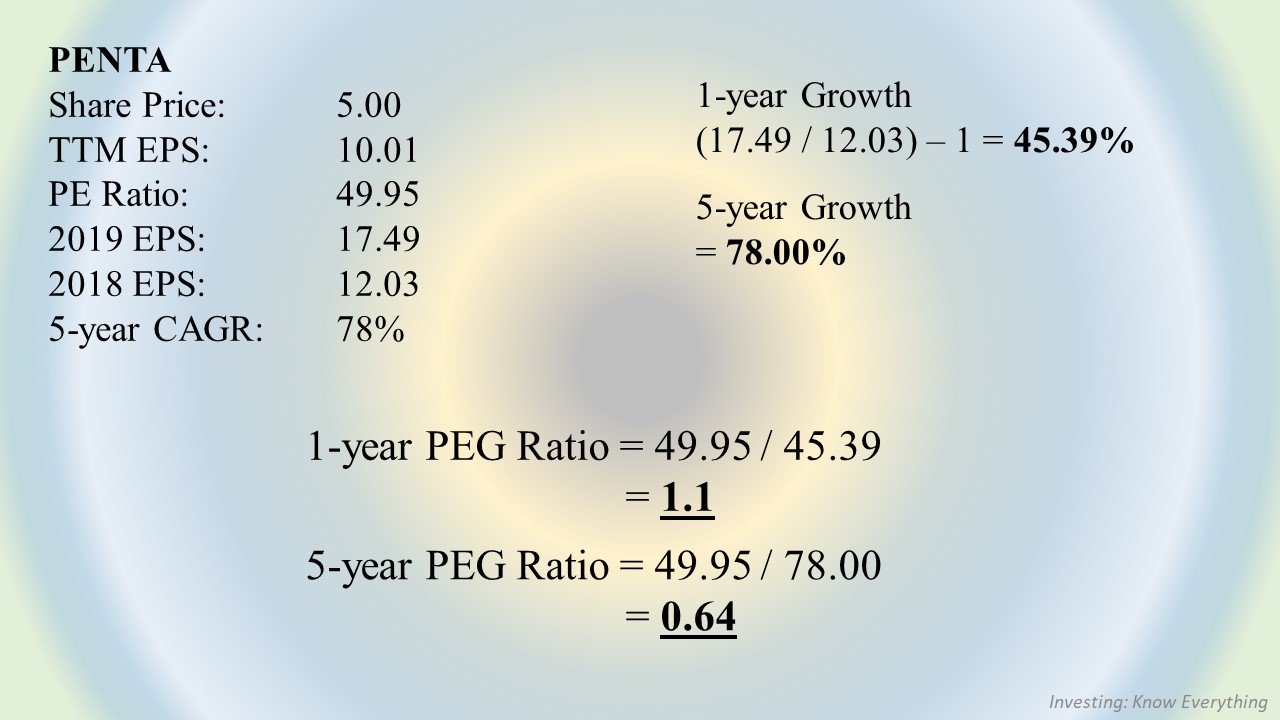
Unlike PE ratio, PEG ratio will be different when different people are calculating it. This is because the estimated growth used will be different, hence different result will be produced.
Let me show you how different growth estimation will lead to different result

Depends on how many years of growth rate the person wanted to use, the result will be different too.
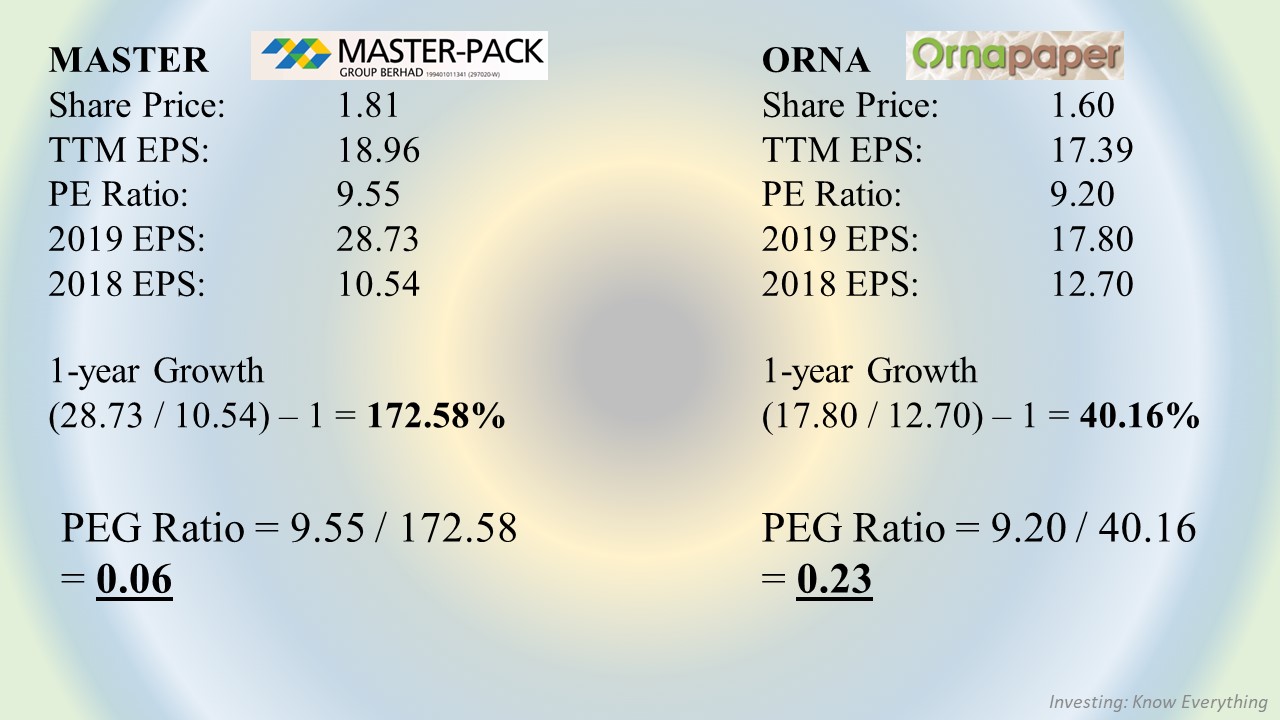
The writer will use another example showing how to compare different companies in a same sector.

When we are just comparing PE ratio, ORNA have the upper hand since it has a lower PE ratio. However, if growth rate is included into the calculation, MASTER have a much lower PEG ratio, hence it is more worthwhile to invest in MASTER.
BUT!
All these information are the history of the companies, meaning that all these are past data. Even the company may look attractive with these old data, but the future growth is still the most important element. A company with a strong fundamental previously is not worth to be invested if they have no future.
In short, PEG ratio is the improvement version of PE ratio where it included growth rate. However, even with a low PEG ratio, the future growth is still the most important element for a growing company. Only buy companies that are growing, and never on those that stop growing.
PEG比率是本益比的进化版,因为它包括了公司的预期盈利成长在内。PEG比率也一样,比较高的数值代表这个股已经被高估,而比较低的数值代表这个股被低估了。
不像本益比,PEG比率会根据不同人的算法而得出不一样的答案。这是因为不同人会给出不同的预期成长,那么出来的结果就会不同。
让我展示给你为什么利用不同的成长会有不同的结果 (请参考以上PENTA的例子)
这就要看个人会选择多少年的成长来计算,得出来的结果也会不同。
笔者接下来会展示如何比较在同个板块的公司。(请参考以上MASTER和ORNA的比较)
当我们只是比较本益比的话,ORNA会比较好因为它有比较低的本益比。但是如果我们也把成长纳入考量的话,MASTER会有更低的PEG比率,所以投资在MASTER会更值得。
但是!
这些资料全部都是公司的历史,代表全部都是过去的资料。即使公司在过去有很亮眼的成绩,但是公司的未来还是最重要的元素。一家在过去有很好基本面的公司,但却没什么未来的不太值得我们去投资。
总结,PEG比率是本益比的进阶版因为它概括了成长率。但是,尽管公司拥有很低的PEG比率,但是未来的成长还是公司最受那个要的元素之一。有成长,不要卖;没成长,不要买。
For more EXCLUSIVE content, visit: https://www.facebook.com/InvestingKnowEverything/
请关注笔者的脸书专页以获得独家资讯。
More articles on Investing: Know Everything
Created by YOLO123 | Feb 02, 2021


