


KLSE Technical Analysis
Abric Is heading to $0.640/$0.670/$0.700

Excutive Summary
1 hour candle, descending triangle breakout away from $0.570 go beyond 0.590, this action was activate 2 consecutive wave 3 formation which is carry bullish imprication, it is heading to $0.640/0.670, the price action pulling futures and instutional trader attention to trade on this stock. In daily trend, Symmetrical triangle Breakout away $ 0.570, Target suggested by the chart pattern was $0.655/0.675
Target of future trader is $0.615/0.670
Target of position trade is $0.635/0.700
Target of Institutional Trader/Inverstor : $0.640/0.670
Resistance $0.600/0.630
Immediated support at 0.560
I will lock partial profit along the resistance line and full profit at the 2nd target
I will apply trailing stop after price pass through resistance line
My stop loss is price close below 0.560.
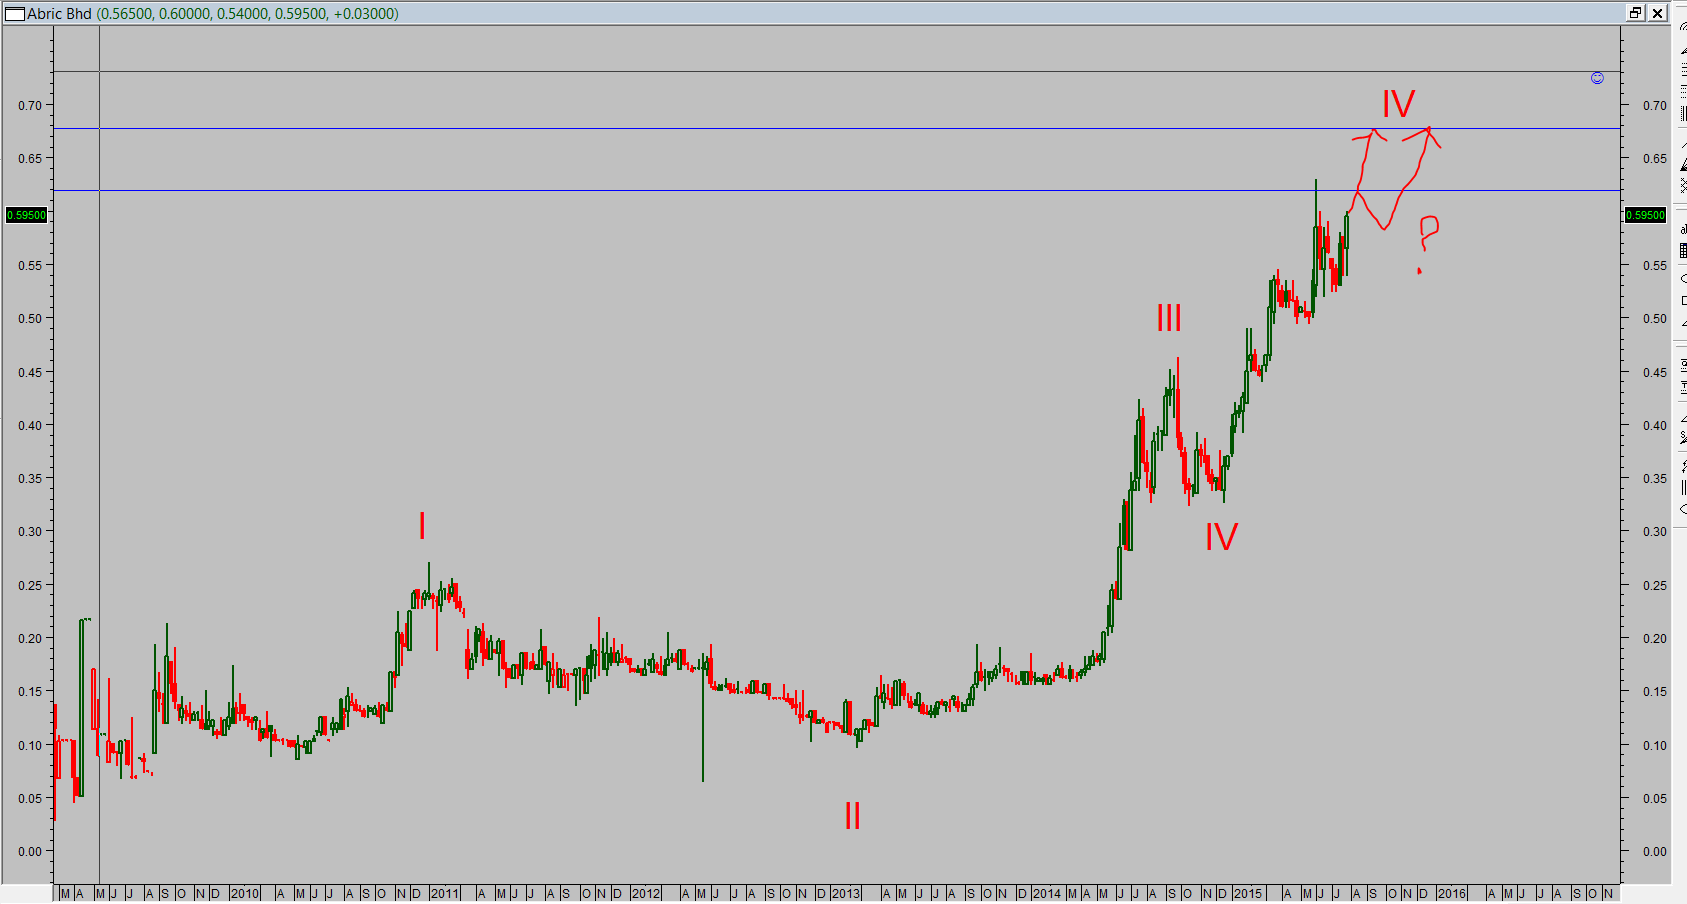
Technical Sharing (Elliot wave)
Weekly Chart is wave 5, which is heading to $0.670/$0.700/$0.750
Daily Chart
Daily wave degree on minor and intermediate is heading to 0.640 and 0.670
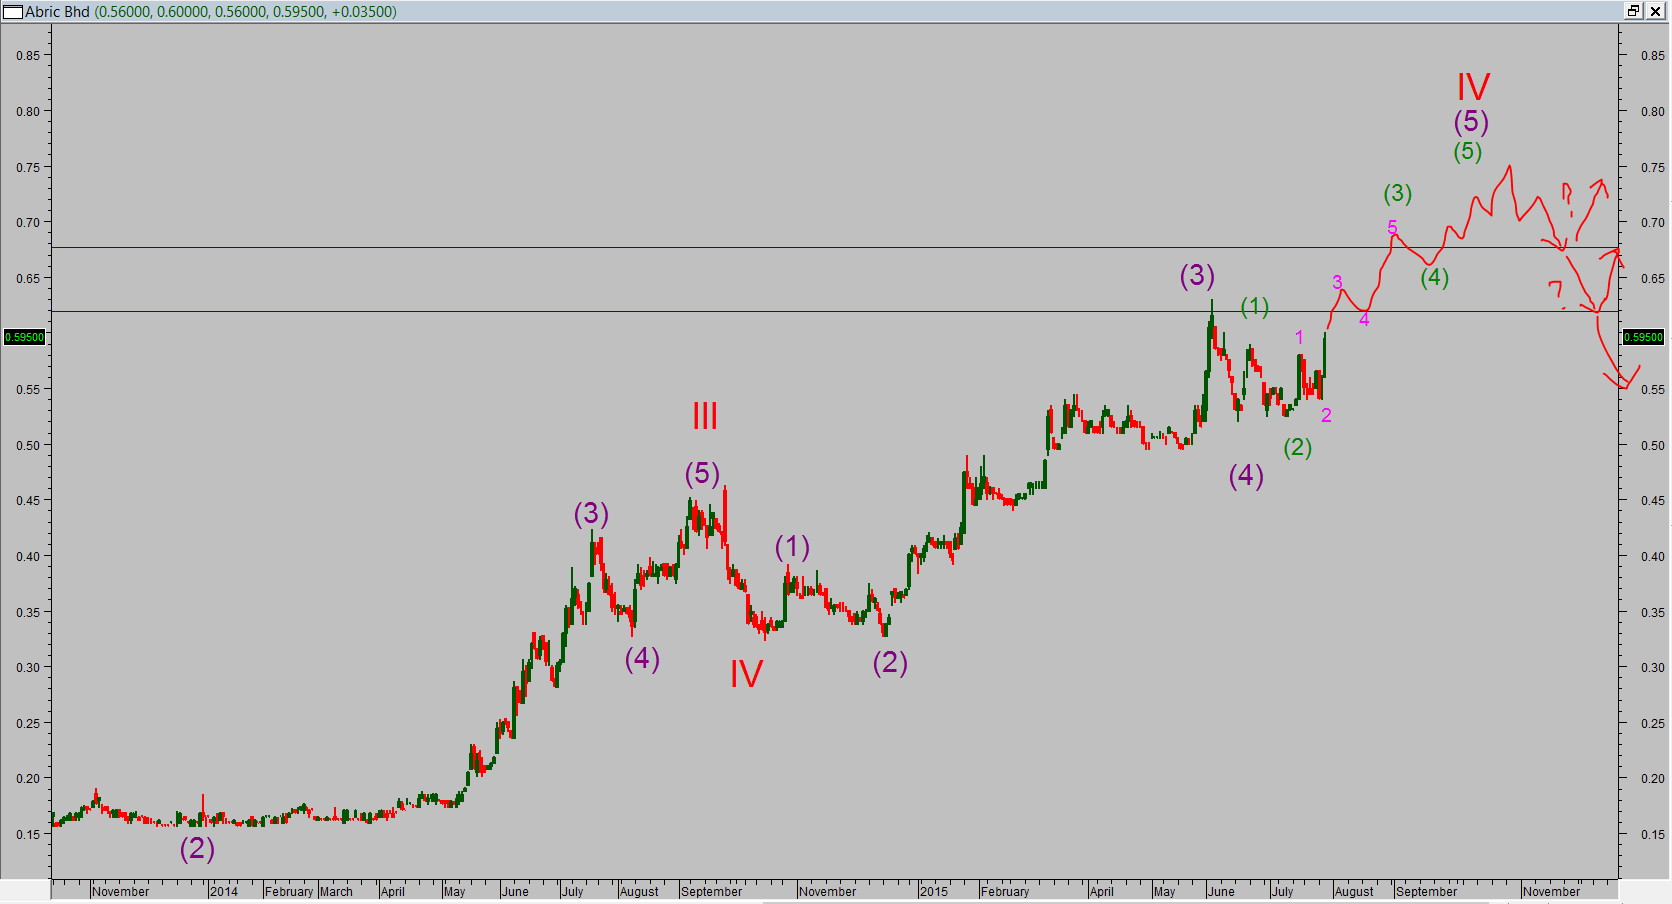
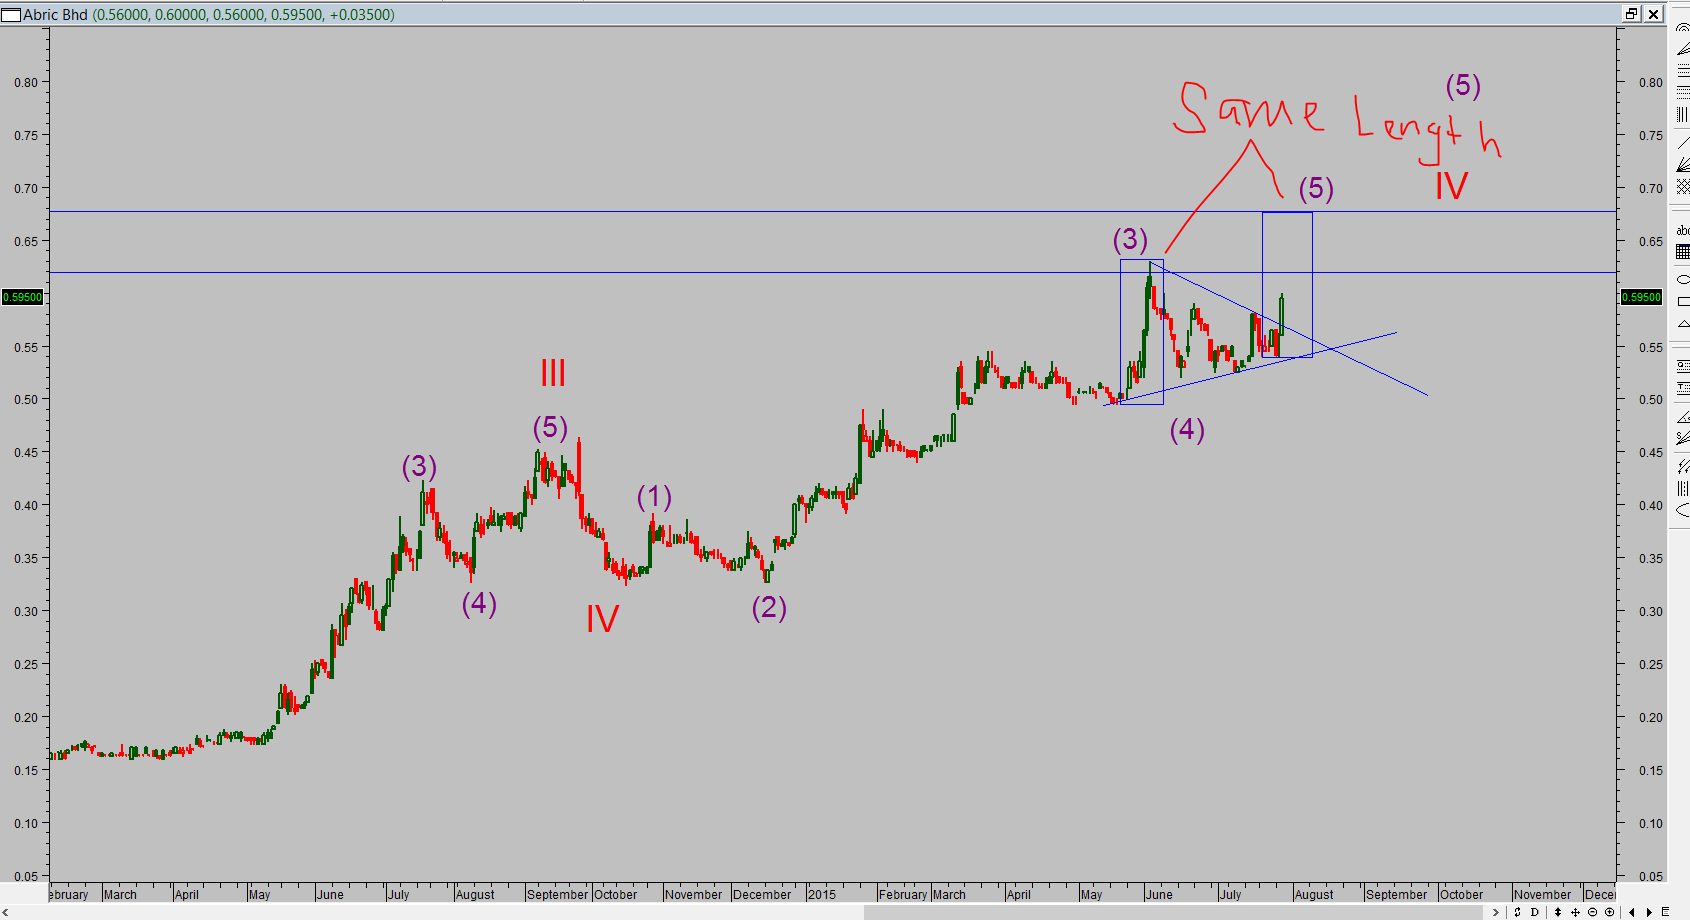
Chart Pattern( triangle Break out),
Daily Chart
Pass data suggested the target prices will reach $0.655/0.675,
More articles on KLSE Technical Analysis
Nov 20th : Market Report on Vivocom. Close $1.74 with volume 68.24m.
Created by mwong3 | Nov 21, 2020
Nov 18th : Market Report on Vivocom. Close $1.86 with volume 33.4m.
Created by mwong3 | Nov 18, 2020
Nov 18th :Morning Session Vivocom cosed $1.83 with volume of 23.1M.
Created by mwong3 | Nov 18, 2020
Discussions
Be the first to like this. Showing 0 of 0 comments
Post a Comment
Featured Posts


Apps


Top Articles
1
https://dividendguy67.blogspot.com
2
3
4
6
Kenanga Research & Investment
7
Good Articles to Share
8
Good Articles to Share
Sydney house fire kills three children, police suspect homicide
#
Stock
Score
Daily Stocks
Stock Name
Last
Change
Volume
Stock Name
Last
Change
Volume
Stock Name
Last
Change
Volume
MQ Trading Signals
Stock
Time
Signal
Duration
No trading signals available.
Stock
Time
Signal
Duration
No trading signals available.
Featured Advertisers / Partners


Ride The Bull Short The Bear
CS Tan
4.9 / 5.0
This book is the result of the author's many years of experience and observation throughout his 26 years in the stockbroking industry. It was written for general public to learn to invest based on facts and not on fantasies or hearsay....