


Technical spots
Triple reasons why FBMKLCI will be very very bullish.

I believe my fellow readers would be familiar with my write up style as full of vulgarity and badmouthing towards FBMKLCI.
However, in this write up, I will be doing something different, I will be sharing insight on FBMKLCI and hence why malaysia market will be very very VERY bullish (soon).
I will highlight the insights casted by Technical analysis of EWM, FBMKLCI, and USD/MYR.
So without further delay, lets dig into the main points.
The first chart is the EWM, listed on US. If you are not familiar with EWM, it can be simply understood as an ETF meant to track FBMKLCI, meaning that it is an ETF meant for US investor/trader to gain exposure to Malaysia equity (FBMKLCI). If you don't understand what I'm saying here, google about ETF (this will be your own homework).
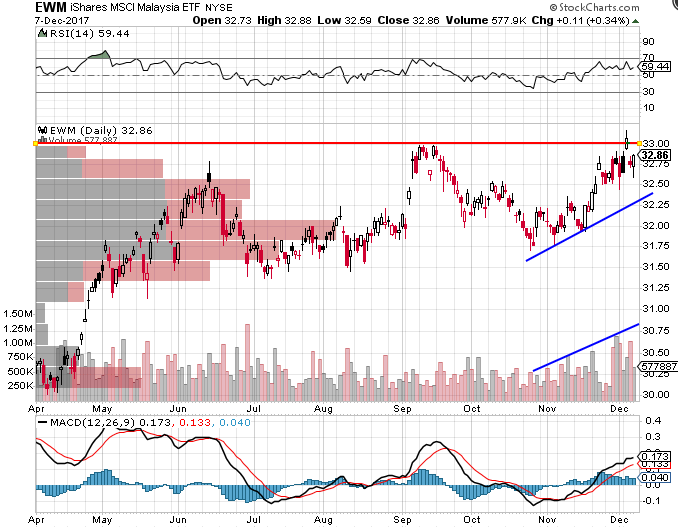
Begining from end of October 2017, the price movement of EWM has displayed an interesting divergence compared to FBMKLCI.
The EWM price has been consistently moving up, the uptrend of EWM was solid as confirmed by increasing volume during the uptrend.
This means wall street has been increasing bullish on our market, as the increasing demand of EWM has drive the price of EWM up.
However if you look at the second chart below (FBMKLCI), FBMKLCI has been treading lower during the same period of time (from end of October until now).
These observations bring us to two possible scenarios:
1. EWM is currently overvalued, and wall street bullish sentiment was wrong about FBMKLCI, EWM should correct down soon; or
2. Our local market was wrong, FBMKLCI is undervalued, wall street bullish sentiment on FBMKLCI was correct, FBMKLCI will go up soon.
Given the stellar GDP growth in the last two quarters, and the general sentiment of the financial market of whole world, FBMKLCI is very likely undervalued, thus the second scenario is the most likely outcome.
The second chart presented here is the FBMKLCI.
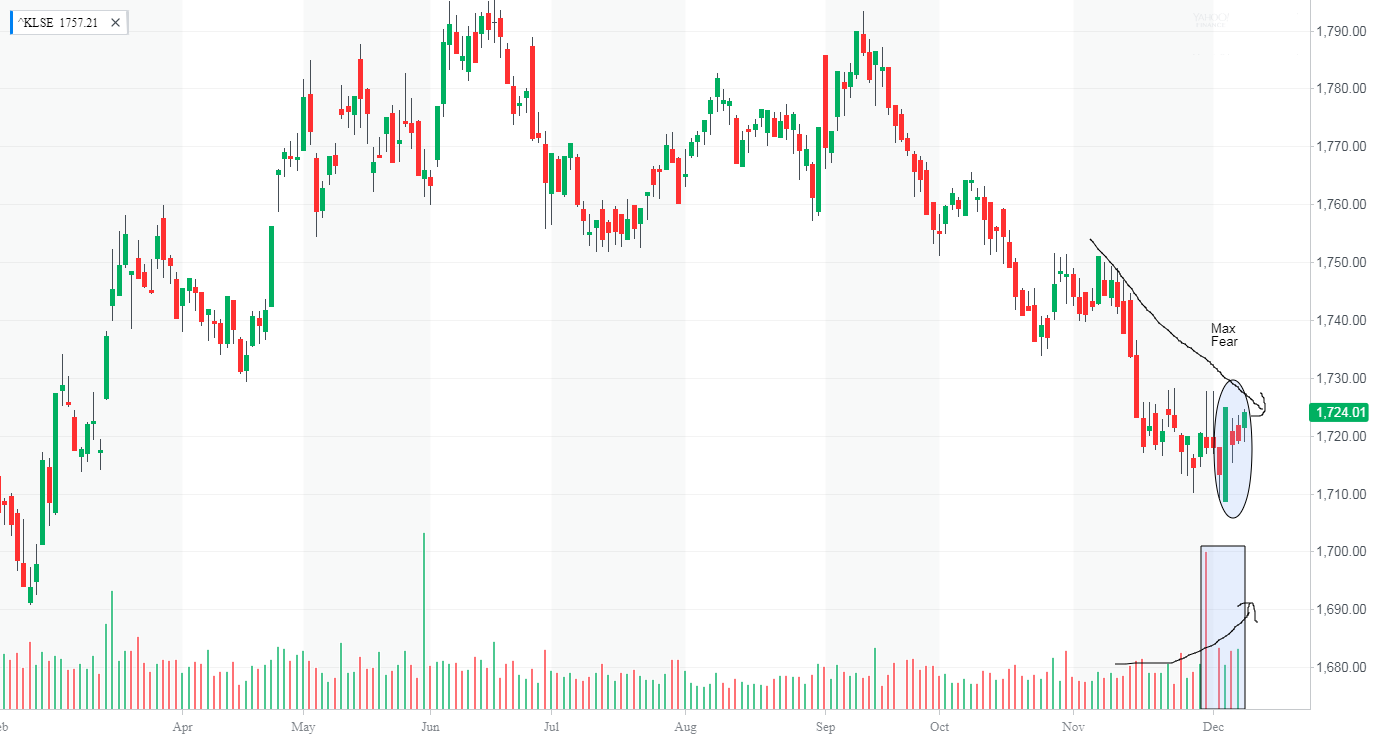
From the technical analysis perspective, the set up shown here actually a good sign that reversal of downtrend is happening (or if not, will happen very very soon).
FBMKLCI has been traded lower since September, however the volume was generally light, implying that the selling pressure was consistently subdued, and selling was steady. However, in the recent few weeks, the volume of FBMKLCI started to increase, indicating the selling pressure was increasingly stronger, as sellers became increasingly panicked and sellers started to pile up.
In fact we are seeing maximum fear currently.
FBMKLCI refuses to trade lower, despite the increasing selling pressure from increased volume in these few days, it is a testament that the intense selling pressure was matched by a strong buying pressure. Therefore, the underlying buying pressure is building up, which will propel FBMKLCI higher after the reversal.
Thus, the high daily trading volume is very likely a blowout volume, which will exhaust the 6 months downtrend, and embark a bullish reversal soon.
There is already a few sign of reversal going on right now.
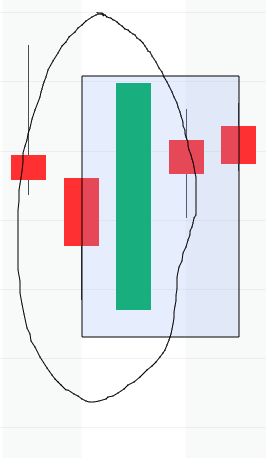
If you look the first 3 candlestick in December, you will notice there is a dual combo reversal candlesticks. Take a closer look in the figure below, which is cropped from the FBMKLCI chart.
The first pair of the left (circled) formed a bullish engulfing pattern, while the second pair on the right (rectangle box) formed a bullish harami pattern. If FBMKLCI close above 1725 (the high of the long green middle candle), the harami candle will be confirmed.
If you don't understand candlestick patterns, google it on your own (this will be your homework).
The third chart presented here is the currency pair USD/MYR. Put it simply, downtrend in USD/MYR means Ringgit is strengthening against greenback and vice versa.
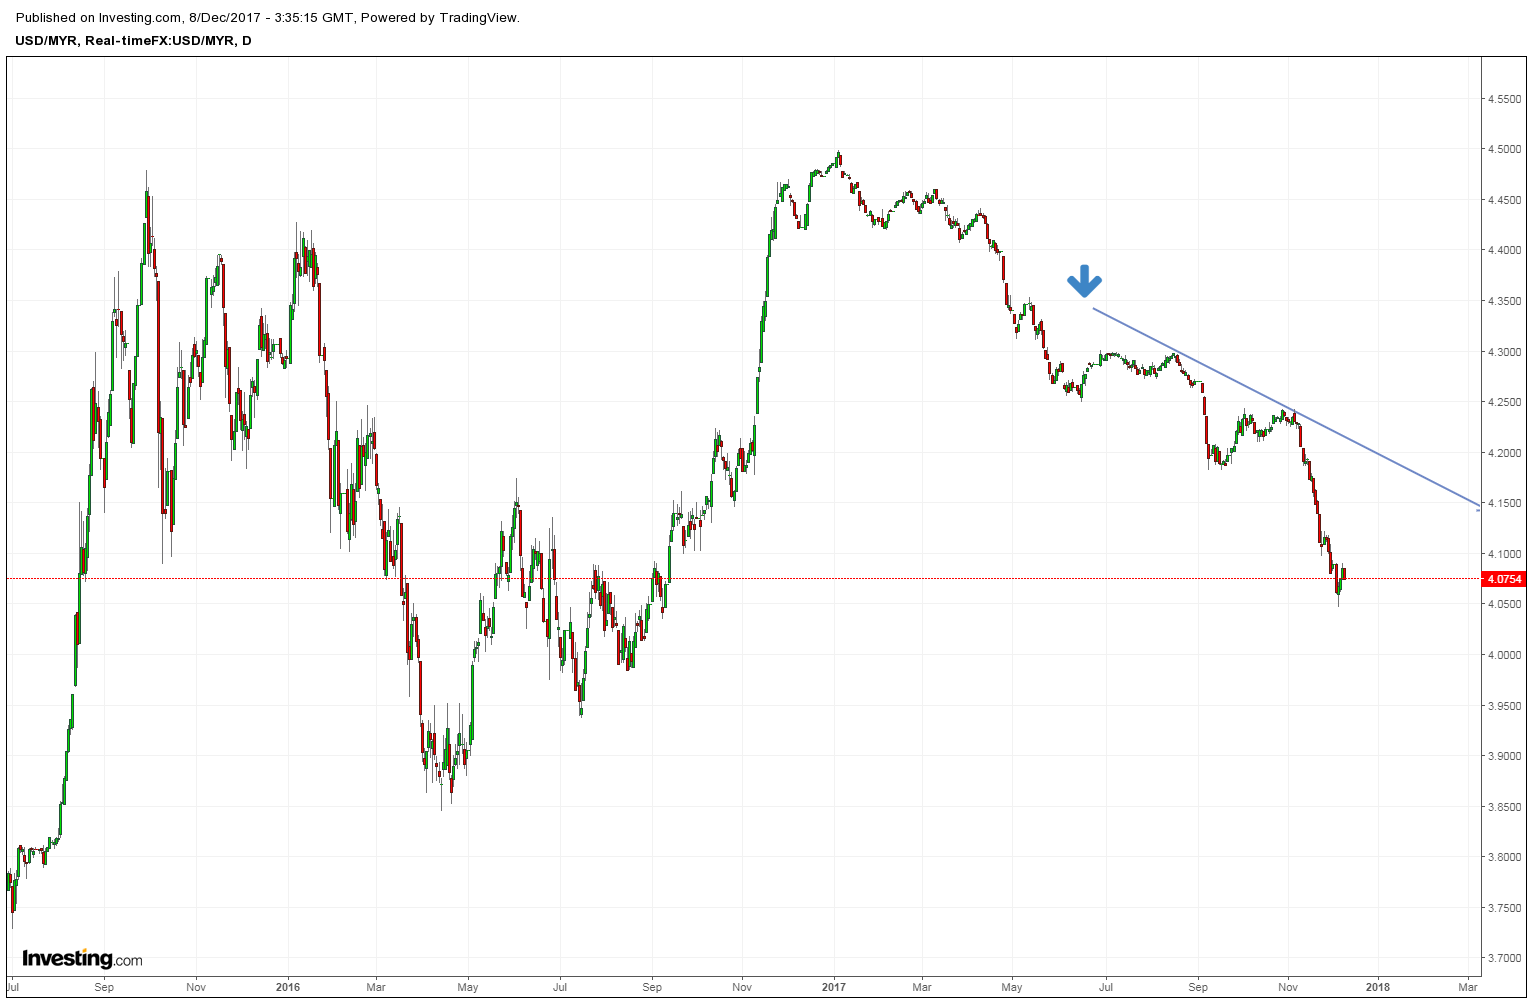
Since June 2017, USD/MYR has been on a strong downtrend. The strengthening of Ringgit against dollar is a prominent evidence showing that demand for Ringgit is growing stronger.
Since BNM has already hinted on further increase in interest rate in 2018, it could be argued that the strengthening of Ringgit was attributed to increase in Ringgit demand due to carry trade.
Regardless of interest rate effect, the increased demand for Ringgit potentially means that hot monies is starting to flow into Malaysia, seeking for profit opportunity. Some of the capital inflow could be going after the carry trade, however some of the foreign funds with higher risk apetite may begin to seep into financial market.
The spillover effect increased demand for Ringgit may already be manifesting as increased trading volume in FBMKLCI these few days.
Summing up, the three charts presented here shows that from macro perspective: wall street is increasingly bullish about FBMKLCI, and capital is flowing into Malaysia, so FBMKLCI will be very bullish in long term.
On the local front, candlestick and chart set up of FBMKLCI suggest the dreaded 6 months correction is ending now, and there will be a strong reversal soon.
More articles on Technical spots
Advanced Technical Analysis: FBMKLCI more immediate upside awaiting.
Created by ScrewDriver | Jan 23, 2018
Reverse Technical Analysis: FBMKLCI throwing smoke bomb to induce maximum fear.
Created by ScrewDriver | Jan 18, 2018
FBMKLCI engine is still warming up, more bullish rally to come.
Created by ScrewDriver | Jan 13, 2018
FBMKLCI and hence whole market to remain highly bullish biased- a reminder
Created by ScrewDriver | Jan 11, 2018
FBMKLCI one piece of puzzle left before confirming 2018 bull market
Created by ScrewDriver | Dec 30, 2017
Discussions
3 people like this. Showing 7 of 7 comments
Hedge Funds Love Tech Again
https://www.bloomberg.com/news/articles/2017-12-08/hedge-funds-love-tech-again-after-calls-for-rotation-fade-away
2017-12-10 09:04
The EWM is tracking MSCI Malaysia Index, I assume it is quite close to FBMKLCI.
Look at the chart provided by you, I checked Yahoo Finance, the low point was 31.77 on 26th October.
Let us compare between 26th October and 8th December.
26th October: EWM=31.77, USD/MYR=4.235, FBMKLCI=1737
8th December: EWM=32.90, USD/MYR=4.090, FBMKLCI=1721
So, in term of RM, EWM has gained 32.90*4.090/31.77/4.235-1=0.01%
For FBMKLCI, there were some dividend ex-dated in the same period, equal to about 7 points.
So, FMBKLCI's gain in the same period was (1721+7)/1737-1=-0.52%
The difference was 0.53% only.
As MSCI Malaysia Index and FBMKLCI are not exactly the same, so 0.53% is possible.
I understand that ETF managers has to do market making, so the ETF price will not differ much from their NAV.
2017-12-10 19:30
Aiyo, why bring attention, let things go down more mah, give me bear market for 5 years can?
2017-12-10 19:34
Local equity market garners positive outlook in 2018 | http://www.klsescreener.com/v2/news/view/317223
2017-12-11 07:18
Post a Comment
Featured Posts
Introducing MY's First IPO Fund for Sophisticated Investors!
New Update. Discover investment communities that resonate with your ideas
M & A Value Partners IPO Equity Fund has been launched - Targeted 13% Return
Latest Videos


Apps


Top Articles
1
Bursa Stock Musings - Thoughts & Ideas
PGF Capital - insti shareholding up from 5% to 14%! (part 1)
2
南洋行家论股
4
How to become a resilient trader
5
RHB Investment Research Reports
6
The Daily Pulse of Bursa Malaysia
7
8
Koon Yew Yin's Blog
#
Stock
Score
Daily Stocks
Stock Name
Last
Change
Volume
Stock Name
Last
Change
Volume
Stock Name
Last
Change
Volume
MQ Trading Signals
Stock
Time
Signal
Duration
Stock
Time
Signal
Duration
Featured Advertisers / Partners


Ride The Bull Short The Bear
CS Tan
4.9 / 5.0
This book is the result of the author's many years of experience and observation throughout his 26 years in the stockbroking industry. It was written for general public to learn to invest based on facts and not on fantasies or hearsay....
Alex Foo
why this article so good no ppl comment. I like! England very gooding. Lez screw klse~ haha.....
don't use vulgar la next time....can angry but can type good england elegantly.
Thanks again. Learn a lot from you.
2017-12-09 22:52