Johotin Breaking Testing the New High Resistance
Edwin Toh
Publish date: Sat, 15 Sep 2012, 11:48 AM
Johotin Breaking Testing the New High Resistance
On the news portion there was an announcement on Friday 14 September
CIRCULAR TO SHAREHOLDERS IN RELATION TO THE
(I) PROPOSED RENOUNCEABLE RIGHTS ISSUE OF 23,326,333 NEW ORDINARY SHARES OF RM1.00 EACH IN JOHORE TIN BERHAD ("JTB" OR THE "COMPANY") ("RIGHTS SHARE(S)") TOGETHER WITH 23,326,333 NEW FREE DETACHABLE WARRANTS ("WARRANT(S)") ON THE BASIS OF ONE (1) RIGHTS SHARE AND ONE (1) WARRANT FOR EVERY THREE (3) EXISTING ORDINARY SHARE(S) OF RM1.00 EACH IN JTB ("JTB SHARE(S)") HELD ON AN ENTITLEMENT DATE TO BE DETERMINED LATER;
(II) PROPOSED INCREASE IN AUTHORISED SHARE CAPITAL OF JTB FROM RM100,000,000 COMPRISING 100,000,000 JTB SHARES to RM200,000,000 COMPRISING 200,000,000 JTB SHARES; AND
(III) PROPOSED AMENDMENTS TO THE MEMORANDUM AND ARTICLES OF ASSOCIATION OF JTB
Check the Full Report <---- Click here
What is RENOUNCEABLE RIGHTS ISSUE.
If you are not sure about it , lets learn about it. Click at this Educational Link. <---- Click here
Let hope that the offer price is above RM 2.6 and more :)
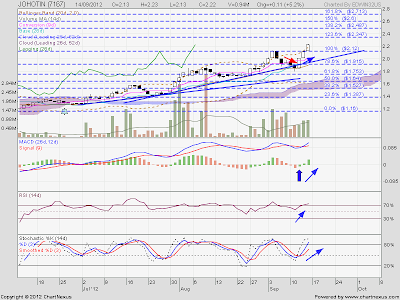
Let Check on the Johotin Chart which was closed on Sept 14 2012.
Old Set of Fibonacci Retracement based of Higher high at 1.87
New Set of Fibonacci Retracement based of Higher high at 2.13
Indicators
1 ) Trendline - Broke above Uptrendline ( Bullish)
2) Support/Resistance - Formed higher low and Higher High (Bullish)
3) MACD - Formed 4R3G (Bullish)
4) RSI - Broke above 70% ( Bullish)
5) STO - Bullish crossover and broke above 80% ( Bullish)
6) Ichimoku - a) Price above support cloud (Bullish).
b) Conversion line above the base line (Bullish).
c) Price above the baseline ( Bullish)
7) Candlestick Pattern : Formed bullish engulfing above a hammer ( Bullish)
Conclusion:
Bullish
Remember to take some profit at 2.32 and 2.45
If you want to purchase this on Next Tuesday ( 18 September)
- make sure your stop loss is at 2.19
Resistance at 2.34 / 2.48
Support at 2.22 / 2.12 / 1.87 / 1.8 / 1.75
To view more or if you have trouble in opening those links . Click here
Related Stocks
| Chart | Stock Name | Last | Change | Volume |
|---|


hoyt
Great articles in the educational link.
2012-09-15 12:52