


WTI Crude Oil Updates
Daily Futures Commentaries: [WTI Crude Oil] 5/6/2018 - Falls nearly 2%, lowest in about 2 months!

InvestorsDoctor
Publish date: Tue, 05 Jun 2018, 10:41 AM
InvestorsDoctor
0 1,969
To get more information on local and foreign futures markets, join us on telegram & Facebook.
Join link: https://t.me/investorsdoctoracademy
Facebook: https://m.facebook.com/investorsdoctoracademy/
Join link: https://t.me/investorsdoctoracademy
Facebook: https://m.facebook.com/investorsdoctoracademy/
5/6/2018
*WTI Crude Oil Jul 18*
Previous Close: 64.75 -1.06
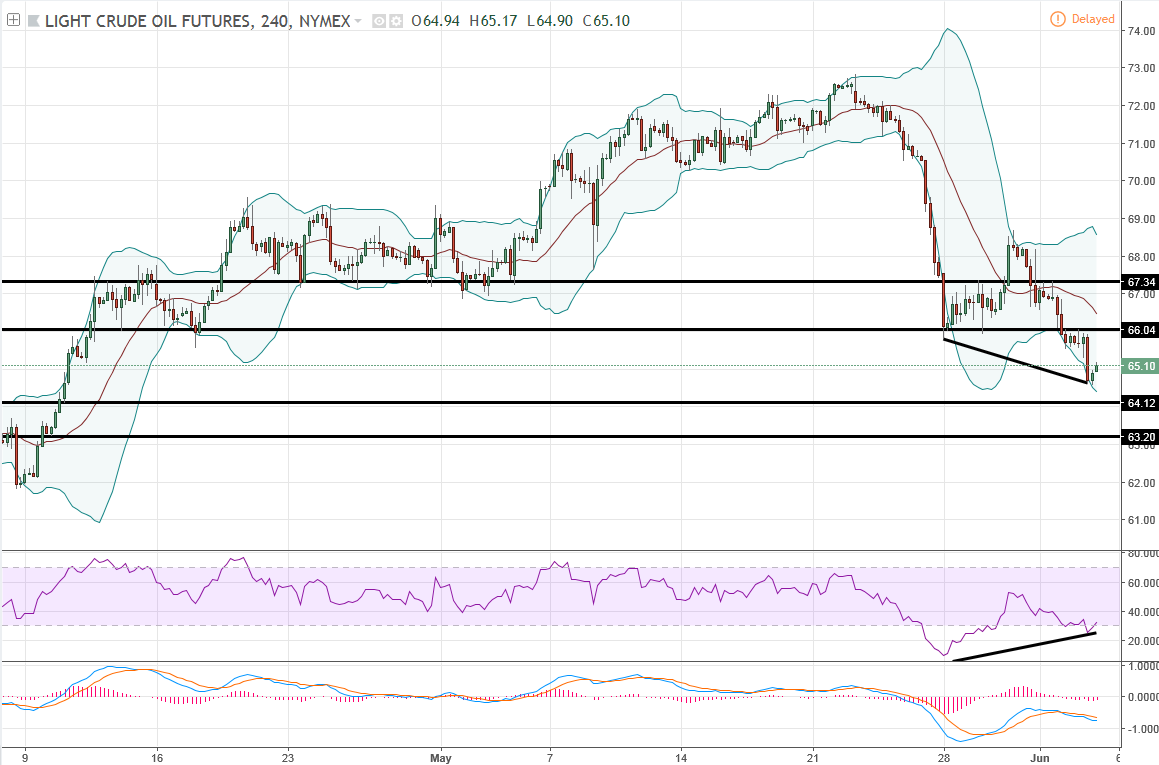
Crude oil marked 3 days losses in a row, touched its lowest in nearly 2 months amid growing US production and possible global supply growth. Watch out for API weekly crude inventories data at 430am tomorrow.
Daily chart formed a three black crows bearish signal while technical indicators more to downside, however there is a bullish divergence in hourly chart, may trigger technical rebound signal, close above 66.04 to form the signal.
*Classic Support & Resistance*
Resistance: 66.04 67.34
Support: 64.12 63.20
*Recommend Trading Plan for the day:*
1. Buy 65.18 for technical rebound, stop 65.04, profit 65.32/65.46.
2. Look for sell signal if break below 64.57.
*WTI Oil Margin Requirement (per lot)*
WTI Crude : USD 2805
Mini Crude : USD 1402.5
Join our channels to find out more!
Telegram link:
https://t.me/investorsdoctoracademy
Facebook link: https://m.facebook.com/investorsdoctoracademy
More articles on WTI Crude Oil Updates
Daily Futures Commentaries: [WTI Crude Oil] 31/12/2019 -Sideway to higher , wait for breakout
Created by InvestorsDoctor | Dec 31, 2019
Daily Futures Commentaries: [WTI Crude Oil] 18/12/2019 - Watch out for weekly stock data
Created by InvestorsDoctor | Dec 18, 2019
Daily Futures Commentaries: [WTI Crude Oil] 17/12/2019 - Watch out for weekly stock data
Created by InvestorsDoctor | Dec 17, 2019
Discussions
Be the first to like this. Showing 0 of 0 comments
Post a Comment
Featured Posts
New Update. Discover investment communities that resonate with your ideas

Apps


Top Articles
1
https://dividendguy67.blogspot.com
3
4
Good Articles to Share
Could Kamala Harris beat Donald Trump in November's presidential race?
5
Good Articles to Share
Iranian warship capsizes during repairs in port of Bandar Abbas
6
Good Articles to Share
7
Good Articles to Share
Jonathan Turley unveils exciting new book 'Free Speech in the Age of Rage'
8
Good Articles to Share
Why Impossible Foods signed hot dog-eating legend Joey Chestnut #yahoofinance #youtubeshorts
#
Stock
Score
Daily Stocks
Stock Name
Last
Change
Volume
Stock Name
Last
Change
Volume
Stock Name
Last
Change
Volume
MQ Trading Signals
Stock
Time
Signal
Duration
No trading signals available.
Stock
Time
Signal
Duration
No trading signals available.
Featured Advertisers / Partners


Ride The Bull Short The Bear
CS Tan
4.9 / 5.0
This book is the result of the author's many years of experience and observation throughout his 26 years in the stockbroking industry. It was written for general public to learn to invest based on facts and not on fantasies or hearsay....