


WTI Crude Oil Updates
Daily Futures Commentaries: [WTI Crude Oil] 11/6/2018 - Slowing China demand & JP Morgan bearish forecast weighed down oil price

InvestorsDoctor
Publish date: Mon, 11 Jun 2018, 12:02 PM
InvestorsDoctor
0 1,969
To get more information on local and foreign futures markets, join us on telegram & Facebook.
Join link: https://t.me/investorsdoctoracademy
Facebook: https://m.facebook.com/investorsdoctoracademy/
Join link: https://t.me/investorsdoctoracademy
Facebook: https://m.facebook.com/investorsdoctoracademy/
11/6/2018
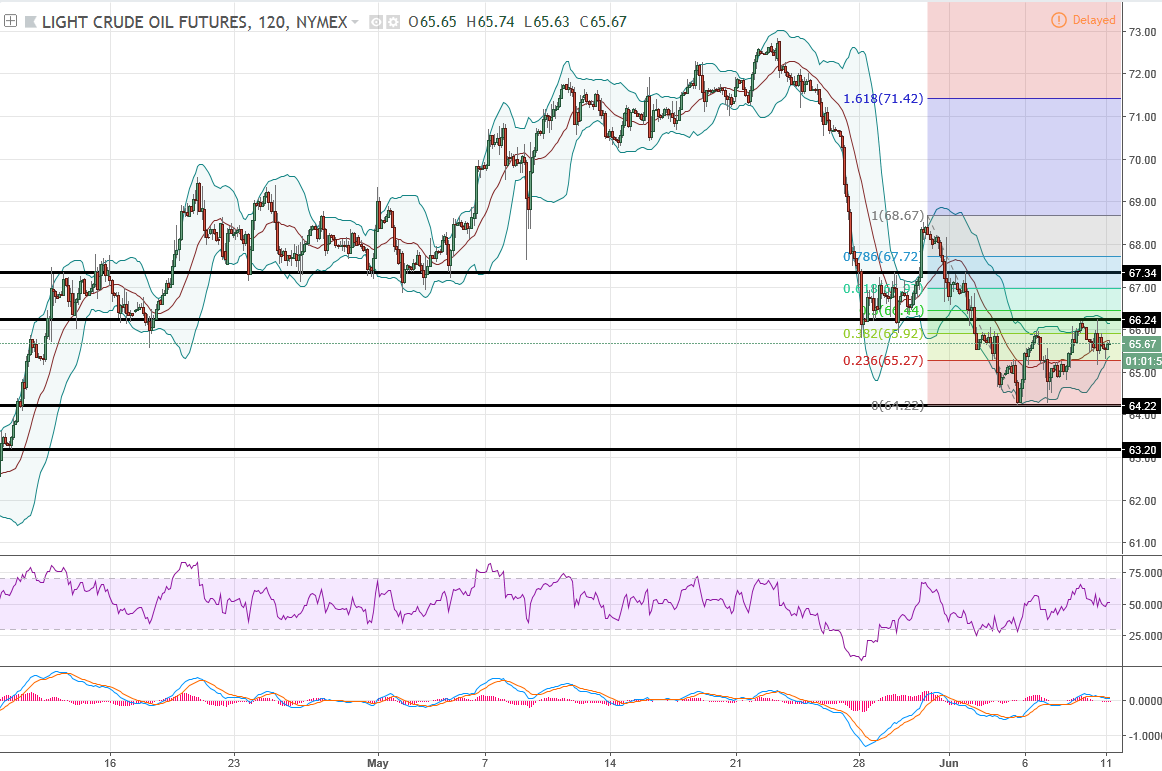
WTI Crude Oil Jul 18
Previous Close: 65.74 -0.21
Crude oil erased its gains and ended slightly lower below 66 as JP Morgan cut oil price forecast and slowing demand from China.
Daily chart show crude oil continue to hover around 50% retracement of previous swing, wait for breakout, but trend still in correction. Hourly chart show a technical rebound from RSI bullish divergence, required to close above 66.24 higher high to trigger further rebound signal.
Classic Support & Resistance
Resistance: 66.24 67.34
Support: 64.22 63.20
Recommend Trading Plan for the day:
1. Trade in 65-66, wait for breakout.
WTI Oil Margin Requirement (per lot)
WTI Crude : USD 2805
Mini Crude : USD 1402.5
Join our channels to find out more!
Telegram link:
https://t.me/investorsdoctoracademy
Facebook link: https://m.facebook.com/investorsdoctoracademy
More articles on WTI Crude Oil Updates
Daily Futures Commentaries: [WTI Crude Oil] 31/12/2019 -Sideway to higher , wait for breakout
Created by InvestorsDoctor | Dec 31, 2019
Daily Futures Commentaries: [WTI Crude Oil] 18/12/2019 - Watch out for weekly stock data
Created by InvestorsDoctor | Dec 18, 2019
Daily Futures Commentaries: [WTI Crude Oil] 17/12/2019 - Watch out for weekly stock data
Created by InvestorsDoctor | Dec 17, 2019
Discussions
Be the first to like this. Showing 0 of 0 comments
Post a Comment
Featured Posts


Apps


Top Articles
1
https://dividendguy67.blogspot.com
3
4
Good Articles to Share
Could Kamala Harris beat Donald Trump in November's presidential race?
5
Good Articles to Share
Iranian warship capsizes during repairs in port of Bandar Abbas
6
Good Articles to Share
7
Good Articles to Share
Jonathan Turley unveils exciting new book 'Free Speech in the Age of Rage'
8
Good Articles to Share
Why Impossible Foods signed hot dog-eating legend Joey Chestnut #yahoofinance #youtubeshorts
#
Stock
Score
Daily Stocks
Stock Name
Last
Change
Volume
Stock Name
Last
Change
Volume
Stock Name
Last
Change
Volume
MQ Trading Signals
Stock
Time
Signal
Duration
No trading signals available.
Stock
Time
Signal
Duration
No trading signals available.
Featured Advertisers / Partners


Ride The Bull Short The Bear
CS Tan
4.9 / 5.0
This book is the result of the author's many years of experience and observation throughout his 26 years in the stockbroking industry. It was written for general public to learn to invest based on facts and not on fantasies or hearsay....