


WTI Crude Oil Updates
Daily Futures Commentaries: [WTI Crude Oil] 9/8/2018 - Trade war tension and more to bearish US oil inventories drag price down nearly 3%

InvestorsDoctor
Publish date: Thu, 09 Aug 2018, 10:42 AM
InvestorsDoctor
0 1,969
To get more information on local and foreign futures markets, join us on telegram & Facebook.
Join link: https://t.me/investorsdoctoracademy
Facebook: https://m.facebook.com/investorsdoctoracademy/
Join link: https://t.me/investorsdoctoracademy
Facebook: https://m.facebook.com/investorsdoctoracademy/
9/8/2018
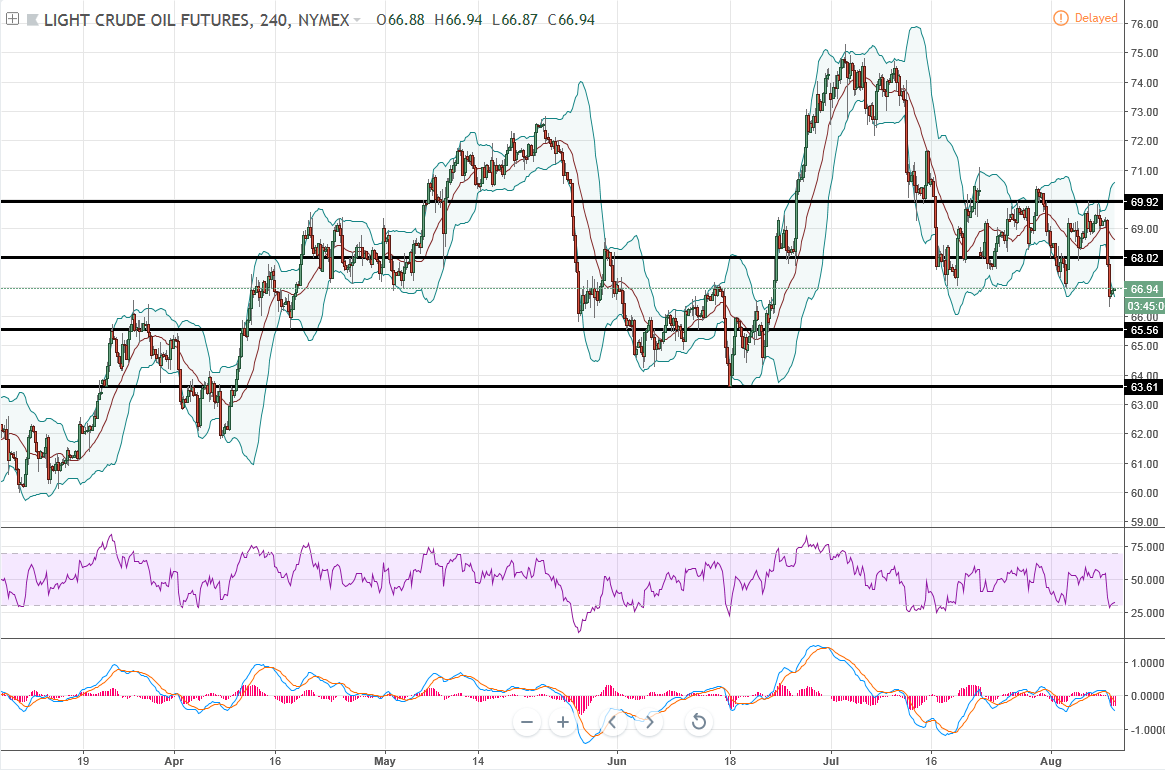
*WTI Crude Oil Sept 18*
Previous Close: 66.94 -2.23
Oil slid about 3% yesterday on a trade dispute between US & China. EIA reported smaller than expected decline in oil inventories and surprise build in gasoline inventories also weighed down the price.
Daily chart showed crude oil in a technical correction stage as candles below middle line of BB, yet overall in a bull trend. Hourly chart showed crude oil break down from sideway, triggered further correction signal, with now testing rebound from RSI oversold.
*Classic Support & Resistance*
Resistance: 68.02 69.92
Support: 65.56 63.61
*Recommend Trading Plan for the day:*
1. Buy 67.01 for technical rebound, stop 66.84, profit 67.18/67.35.
2, Look for sell signal below 66.71.
*WTI Oil Margin Requirement (per lot)*
WTI Crude : USD 3795
Mini Crude : USD 1897.50
Disclaimer: Idea sharing only, trade at your own risk.
Join our channels to find out more!
Telegram link:
https://t.me/investorsdoctoracademy
Facebook link: https://m.facebook.com/investorsdoctoracademy
More articles on WTI Crude Oil Updates
Daily Futures Commentaries: [WTI Crude Oil] 31/12/2019 -Sideway to higher , wait for breakout
Created by InvestorsDoctor | Dec 31, 2019
Daily Futures Commentaries: [WTI Crude Oil] 18/12/2019 - Watch out for weekly stock data
Created by InvestorsDoctor | Dec 18, 2019
Daily Futures Commentaries: [WTI Crude Oil] 17/12/2019 - Watch out for weekly stock data
Created by InvestorsDoctor | Dec 17, 2019
Discussions
Be the first to like this. Showing 0 of 0 comments
Post a Comment
Featured Posts


Apps


Top Articles
1
https://dividendguy67.blogspot.com
3
4
Good Articles to Share
Could Kamala Harris beat Donald Trump in November's presidential race?
5
Good Articles to Share
Iranian warship capsizes during repairs in port of Bandar Abbas
6
Good Articles to Share
7
Good Articles to Share
Jonathan Turley unveils exciting new book 'Free Speech in the Age of Rage'
8
Good Articles to Share
Why Impossible Foods signed hot dog-eating legend Joey Chestnut #yahoofinance #youtubeshorts
#
Stock
Score
Daily Stocks
Stock Name
Last
Change
Volume
Stock Name
Last
Change
Volume
Stock Name
Last
Change
Volume
MQ Trading Signals
Stock
Time
Signal
Duration
No trading signals available.
Stock
Time
Signal
Duration
No trading signals available.
Featured Advertisers / Partners


Ride The Bull Short The Bear
CS Tan
4.9 / 5.0
This book is the result of the author's many years of experience and observation throughout his 26 years in the stockbroking industry. It was written for general public to learn to invest based on facts and not on fantasies or hearsay....