


WTI Crude Oil Updates
Daily Futures Commentaries: [WTI Crude Oil] 10/12/2018 - OPEC & allies reached new oil cut deal, boosted oil price

InvestorsDoctor
Publish date: Mon, 10 Dec 2018, 10:05 AM
InvestorsDoctor
0 1,969
To get more information on local and foreign futures markets, join us on telegram & Facebook.
Join link: https://t.me/investorsdoctoracademy
Facebook: https://m.facebook.com/investorsdoctoracademy/
Join link: https://t.me/investorsdoctoracademy
Facebook: https://m.facebook.com/investorsdoctoracademy/
10/12/2018
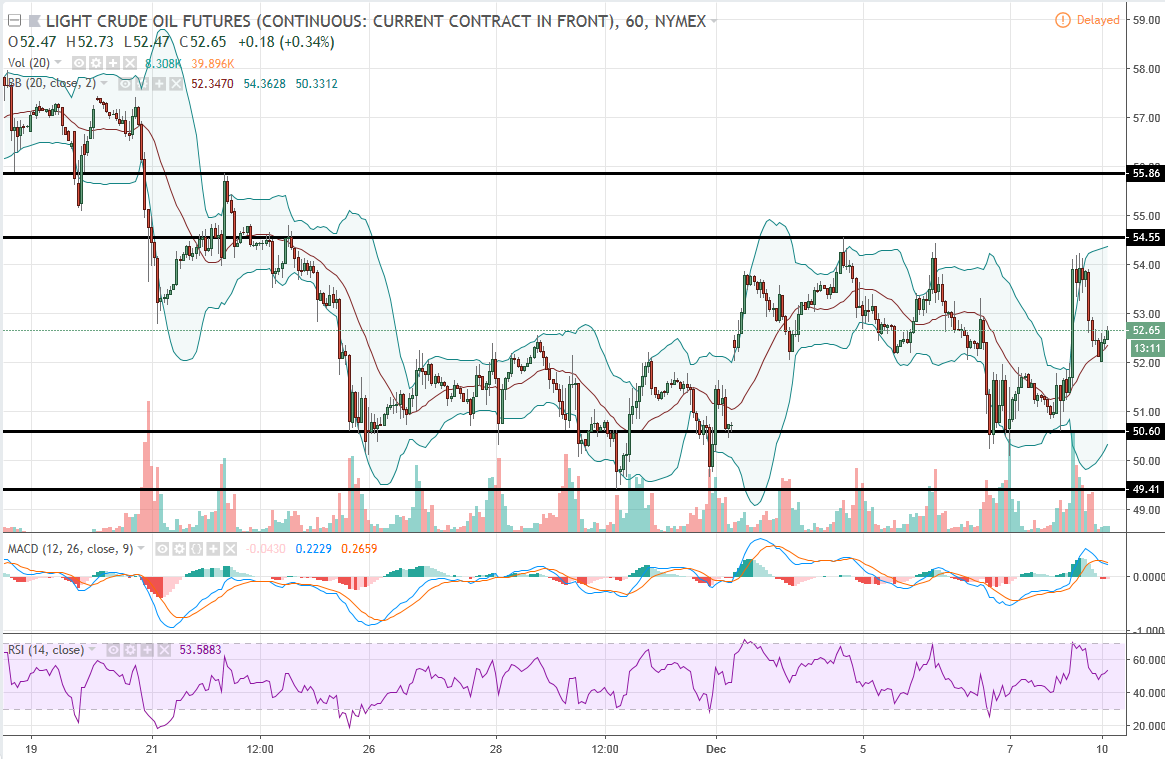
*WTI Crude Oil Jan 19*
Previous Close: 52.61 +1.12
Oil prices surged more than 2% on last Friday after OPEC and its allies agreed to cut output by 1.2 million bpd during the first six months of 2019.
Hourly chart showed oil in sideway but turn to slightly bullish as technical indicators trending upside, wait for mroe breakout.
*Classic Support & Resistance*
Resistance: 54.55 55.86
Support: 50.60 49.41
*Recommend Trading Plan for the day:*
1. Buy 52.69 for technical rebound, stop 52.55, profit 52.83/52.97.
2. Look for sell signal below 52
*WTI Oil Margin Requirement (per lot)*
WTI Crude : USD 4015
Mini Crude : USD 2007.5
Disclaimer: Idea sharing only, trade at your own risk.
Please SHARE & SUBSCRIBE our YOUTUBE channel for latest FREE videos !!!
https://www.youtube.com/channel/UCnOB_UmIXe3OTE2SgiK9kpg
Join our other channels to find out more about futures trading !!!
Telegram link:
https://t.me/investorsdoctoracademy
Facebook link:
https://m.facebook.com/investorsdoctoracademy
More articles on WTI Crude Oil Updates
Daily Futures Commentaries: [WTI Crude Oil] 31/12/2019 -Sideway to higher , wait for breakout
Created by InvestorsDoctor | Dec 31, 2019
Daily Futures Commentaries: [WTI Crude Oil] 18/12/2019 - Watch out for weekly stock data
Created by InvestorsDoctor | Dec 18, 2019
Daily Futures Commentaries: [WTI Crude Oil] 17/12/2019 - Watch out for weekly stock data
Created by InvestorsDoctor | Dec 17, 2019
Discussions
Be the first to like this. Showing 0 of 0 comments
Post a Comment
Featured Posts
New Update. Discover investment communities that resonate with your ideas

Apps


Top Articles
1
https://dividendguy67.blogspot.com
3
4
Good Articles to Share
Could Kamala Harris beat Donald Trump in November's presidential race?
5
Good Articles to Share
Iranian warship capsizes during repairs in port of Bandar Abbas
6
Good Articles to Share
7
Good Articles to Share
Jonathan Turley unveils exciting new book 'Free Speech in the Age of Rage'
8
Good Articles to Share
Why Impossible Foods signed hot dog-eating legend Joey Chestnut #yahoofinance #youtubeshorts
#
Stock
Score
Daily Stocks
Stock Name
Last
Change
Volume
Stock Name
Last
Change
Volume
Stock Name
Last
Change
Volume
MQ Trading Signals
Stock
Time
Signal
Duration
No trading signals available.
Stock
Time
Signal
Duration
No trading signals available.
Featured Advertisers / Partners


Ride The Bull Short The Bear
CS Tan
4.9 / 5.0
This book is the result of the author's many years of experience and observation throughout his 26 years in the stockbroking industry. It was written for general public to learn to invest based on facts and not on fantasies or hearsay....