


Sharing News/Announcements & More
Aturmaju Technical Analysis - Uptrend

Original Post : https://www.investingnote.com/posts/1220353
Hi all, according to what i posted on 16 January saying that Aturmaju Resources Berhad(7181) is a worth looking stock counter makes me interested to do a proper TA on this stock. Here is my analysis and you can download the PDF file for better reading.
$ATURMJU(7181.MY) Aturmaju Technical Analysis - Uptrend
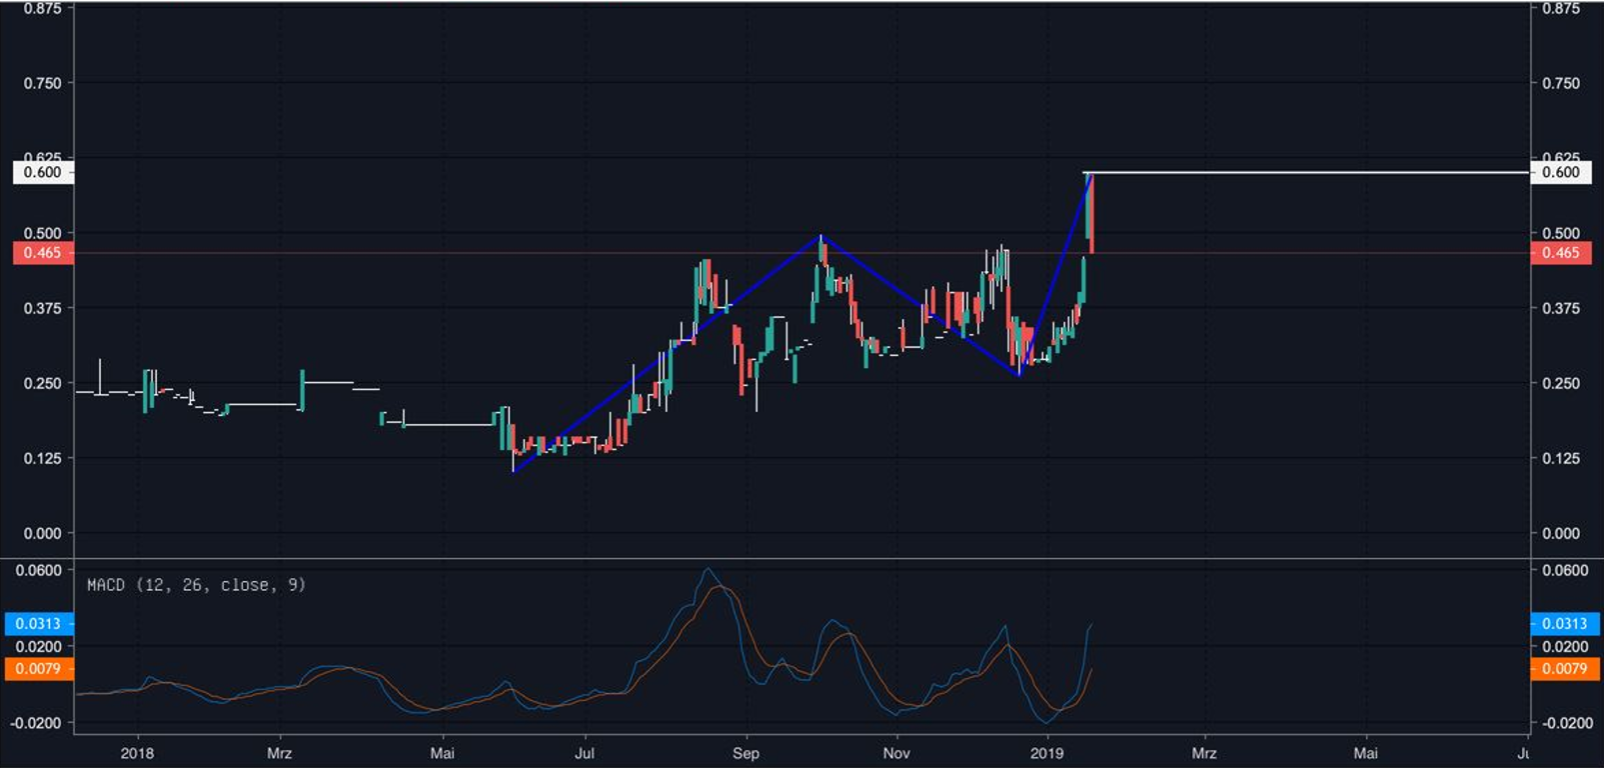
Image 1
Overview: (Daily Chart)
Aturmaju Resources Berhad is moving in an big uptrend since June 2018. The breakout above the 0.500 level confirmed this upward trend. The probability is high that the trend will continue and that rising prices can also be expected in the future.
Also the moving averages of the MACD are bullish crossed and are already above the zero line. This is another long signal.
The upward movement has increased rapidly in the last few days with a lot of volume, so it is normal that a smaller correction occurs. Yesterday's correction should be seen as pure profit taking by investors.
After completion of the correction, the last local high at 0.600 should be reached within a very short time.
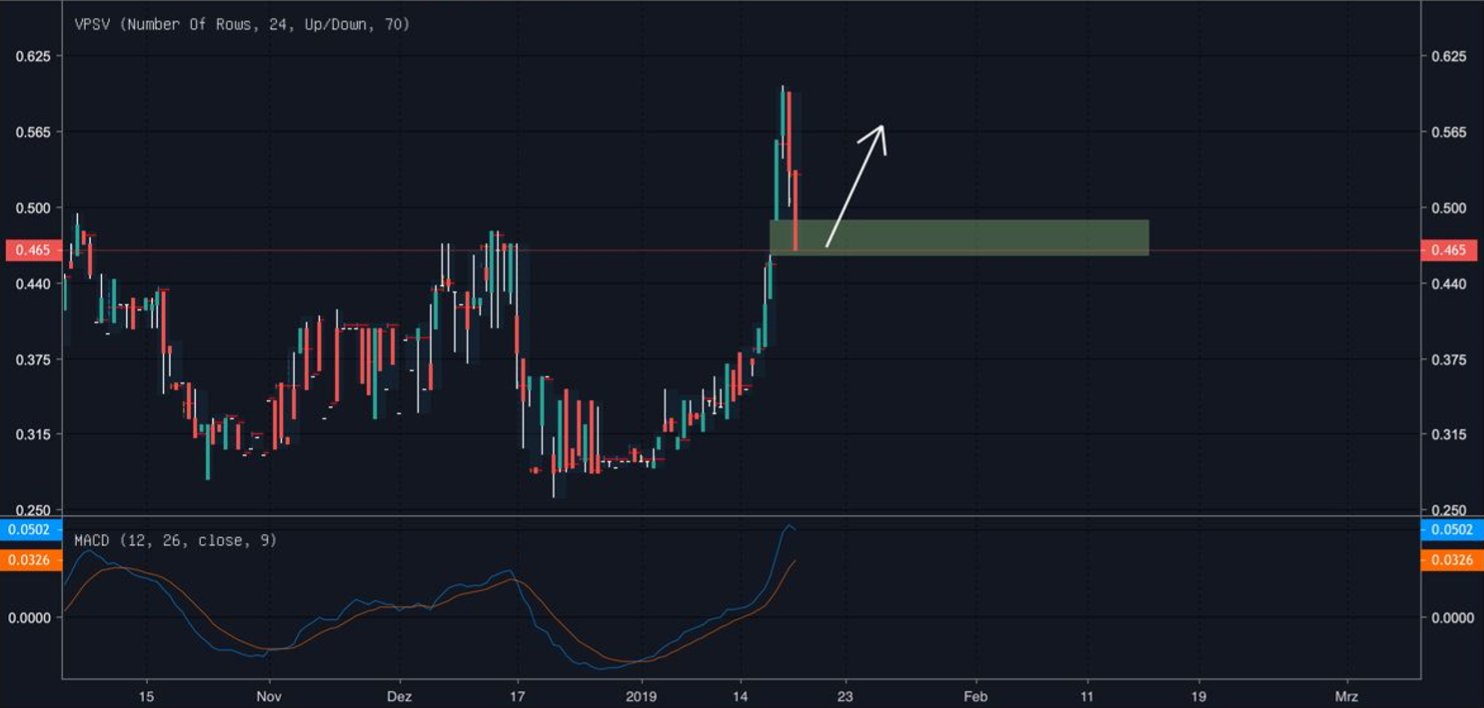
Image 2:
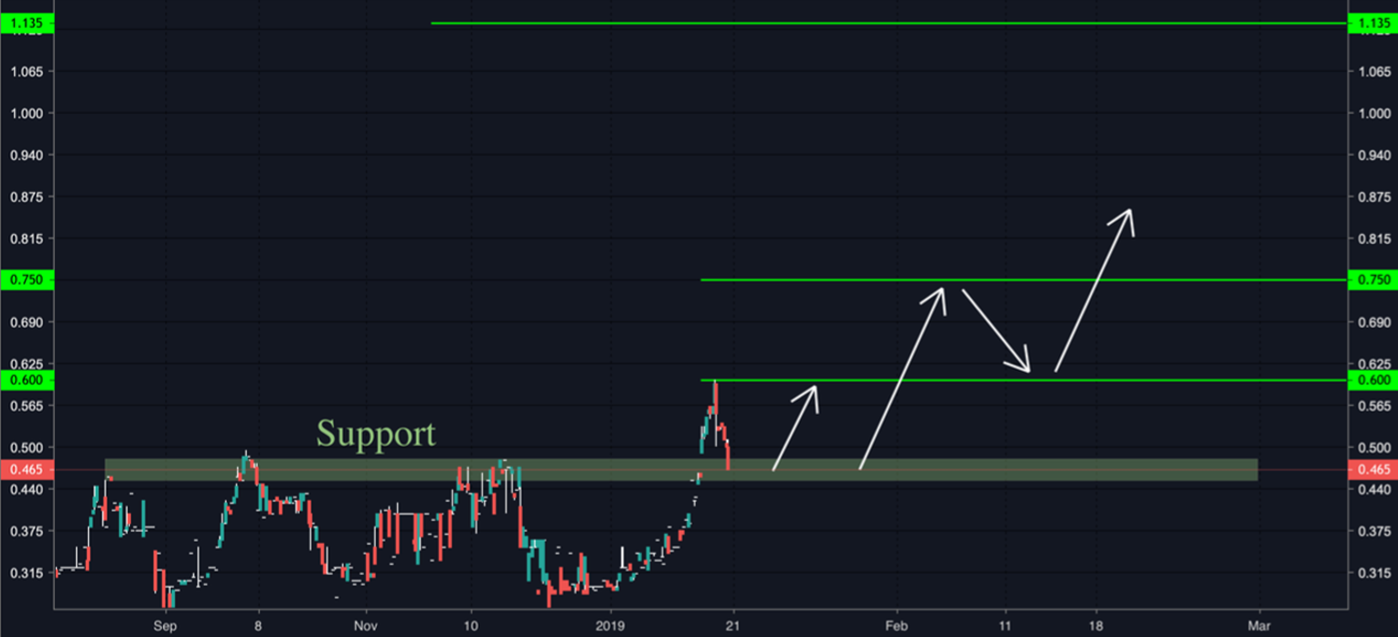
4 Hour Chart
If you take a closer look at the price movement from the 4 hour chart, you can clearly see a gap close. In addition, the price hits the last local high at 0,465, which is to be regarded as support.Short-term traders should definitely keep an eye on the current price mark, as increasing volume is very likely. In addition, there are two more signals for a quick long entry.
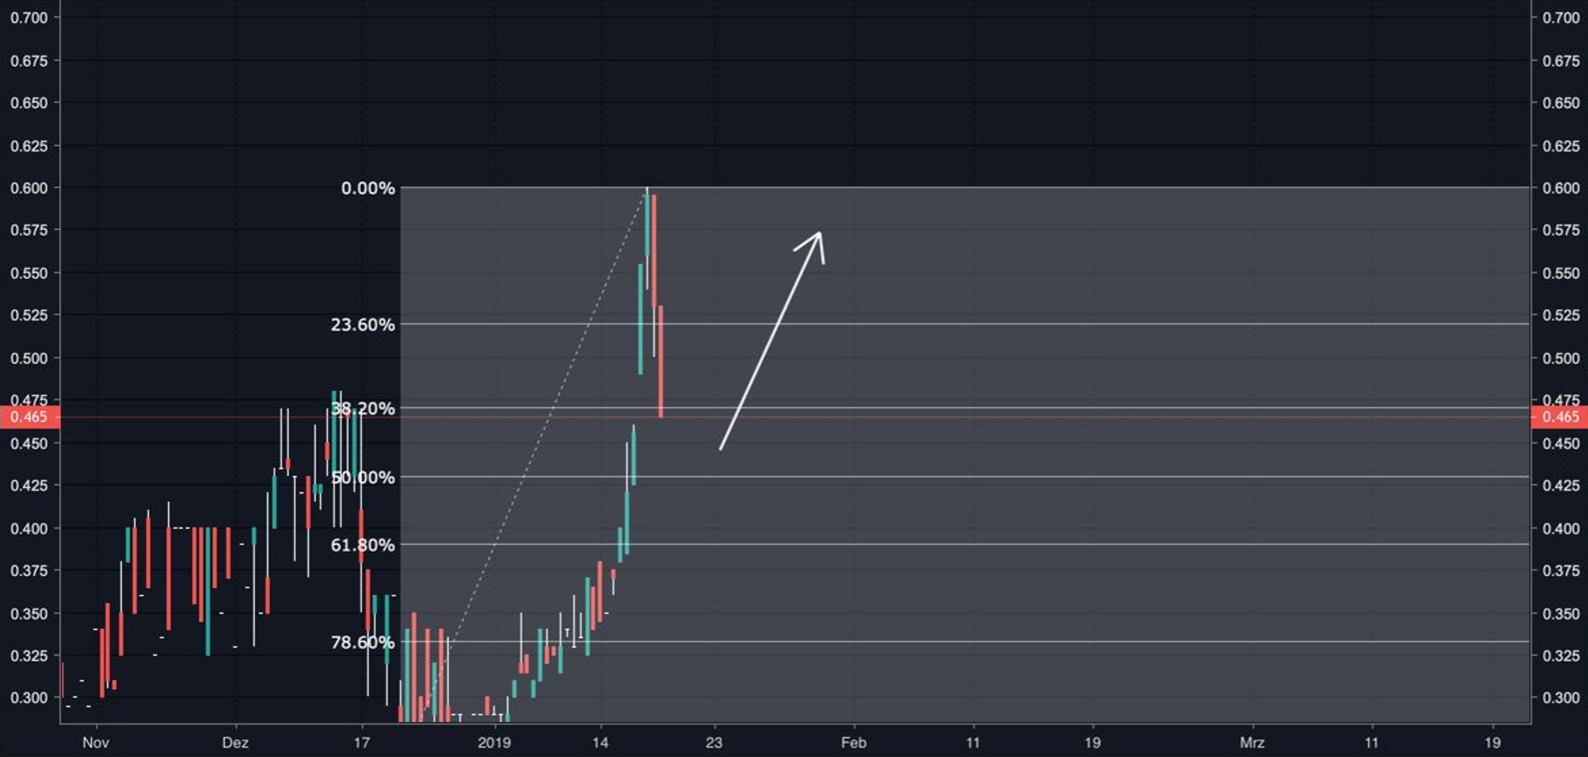
Image 3:
The gap close is additionally a movement to the 50 Fibonacci retracement. Often there are many buyers at the 50 Fibonacci Retracement who want to take advantage of the trade from the correction.
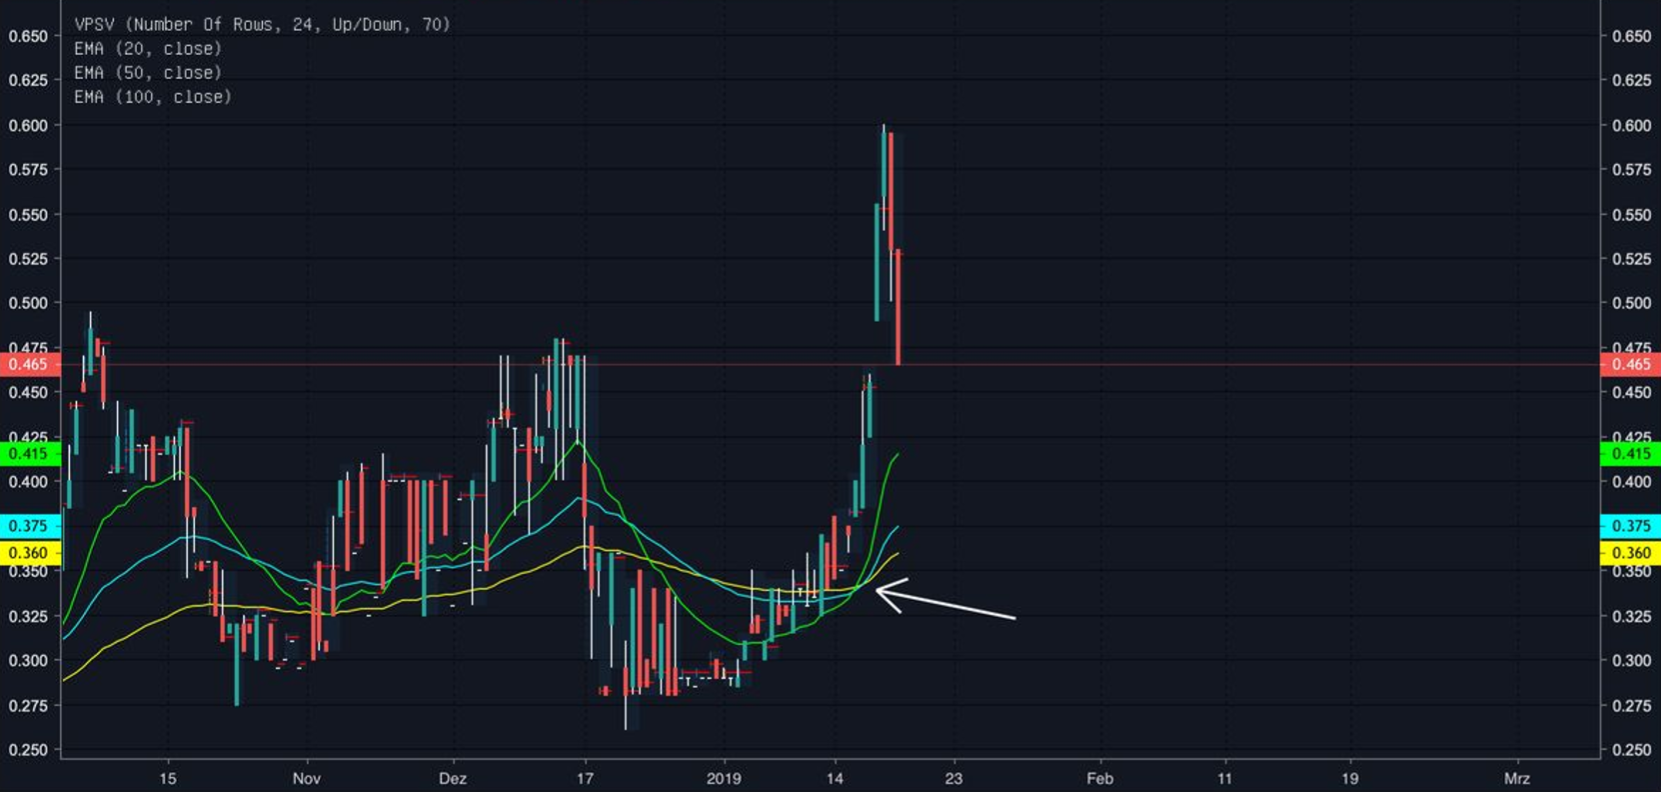
Image 4:
For traders who prefer to trade with moving averages, there is also a clear buy-signal. The last price increase resulted in a crossing of several exponential moving averages. The 20 EMA, 50 EMA and 100 EMA currently fan out cleanly. In order to find the perfect entry, you should wait for the smaller units such as the 15 min chart to turn the trend in the direction of the higher trend.
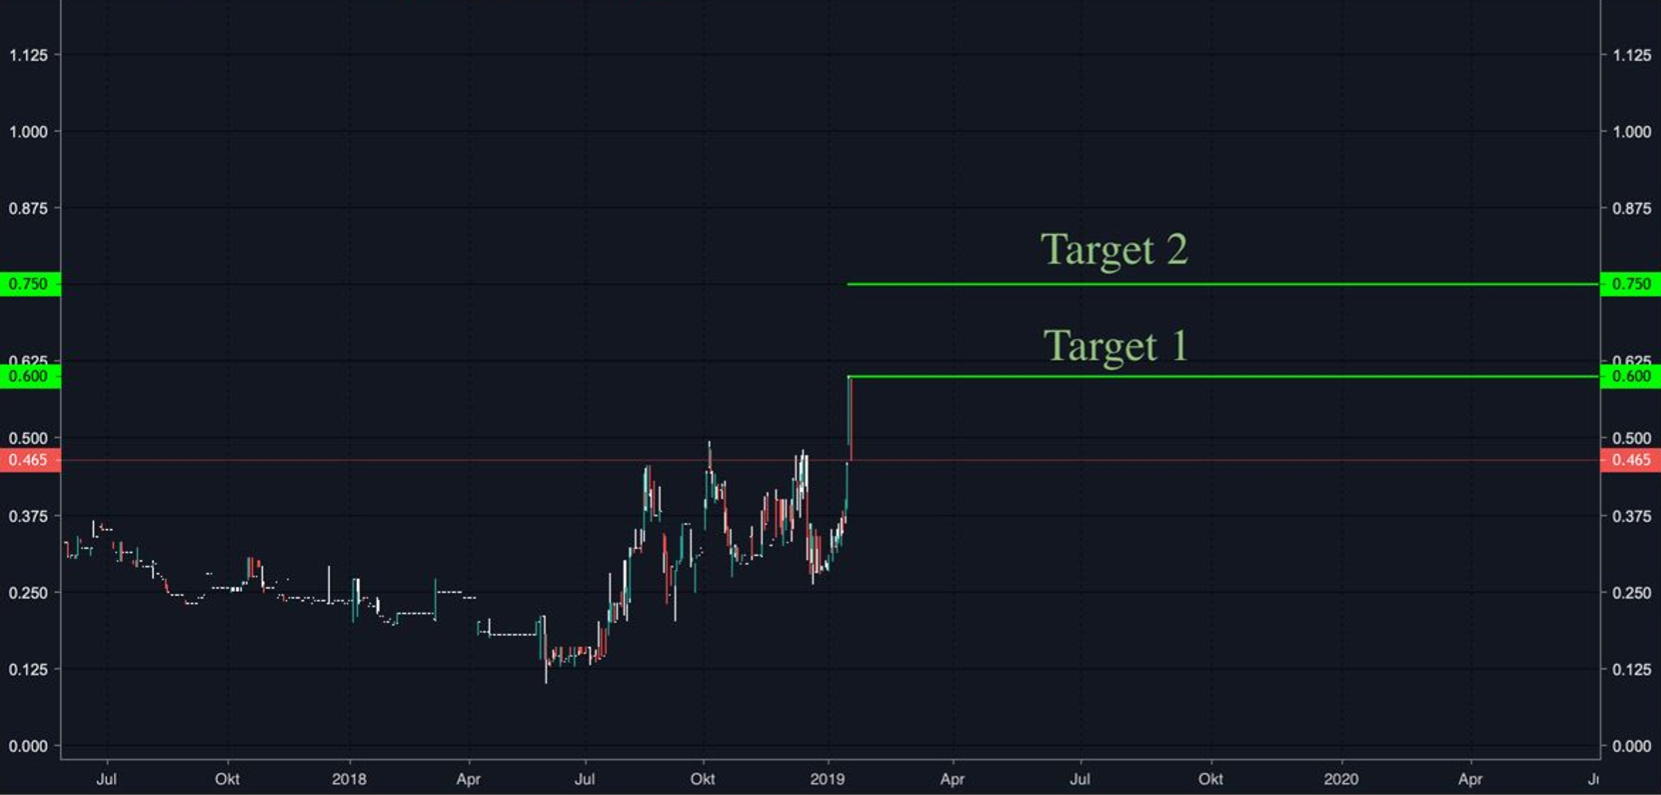
Image 5&6: Summary
Aturmaju Resources Berhad is a clear buy recommendation. Especially short-term traders should be able to realize quick profits. But for the longer-term oriented, the current market situation is favorable.
The price is in an intact and solid upward trend. The gap close is additionally supported by a Fibonacci reatracement and the cross of several EMAs is another clear buy signal.
It's definitely not too late. The situation is very favourable at the moment. The first target at 0.600 is only one target. I would recommend to divide the position by three.
For example you buy 3000 pieces for 0.46. 1000 you sell at 0.600 (0.14 per piece profit); 1000 you sell at 0.750 (0.29 per piece profit) and the last third can be held if the prices continue to rise.
So you quickly secure a small profit and still have the chance to make a big profit. The chance risk ratio is better with this method.
More articles on Sharing News/Announcements & More
Another top stock pick secures RM20mil per year contract on today - Aturmaju
Created by ChanZheKang | Jan 24, 2019
From wood manufacturer to IT provider - Aturmaju Resources Bhd (7181)
Created by ChanZheKang | Jan 21, 2019
Grand Venture Technology (GVT) IPO: Here Are 6 Key Things You Should Know
Created by ChanZheKang | Jan 21, 2019
US-China trade deal ‘could well happen’, Donald Trump says, but there may be a catch
Created by ChanZheKang | Jan 21, 2019
Featured Posts


Latest Videos


Apps


Top Articles
1
CEO Morning Brief
2
南洋行家论股
3
Good Articles to Share
4
5
Good Articles to Share
Expect another 'sluggish' housing market in 2025: Real estate advisor
6
Good Articles to Share
Attorney slams judge over Trump sentencing: ’Constitutionally crippled’ #shorts
7
Good Articles to Share
WATCH LIVE: Former President Jimmy Carter’s funeral services begin
8
Good Articles to Share
Russia declares emergency in Crimea after Black Sea oil spill | REUTERS
#
Stock
Score
Daily Stocks
Stock Name
Last
Change
Volume
Stock Name
Last
Change
Volume
Stock Name
Last
Change
Volume
MQ Trading Signals
Stock
Time
Signal
Duration
No trading signals available.
Stock
Time
Signal
Duration
No trading signals available.
Featured Advertisers / Partners


Ride The Bull Short The Bear
CS Tan
4.9 / 5.0
This book is the result of the author's many years of experience and observation throughout his 26 years in the stockbroking industry. It was written for general public to learn to invest based on facts and not on fantasies or hearsay....
LimKT
today 0.39, those who want to invest can buy now and hold until either they sign the contract of 20milion with Yes's or wait Q4 result.
2019-01-23 17:15