QL Resources Berhad - Worth investing now?
ChanZheKang
Publish date: Wed, 23 Jan 2019, 12:00 AM
Original Post: https://www.investingnote.com/posts/1222001
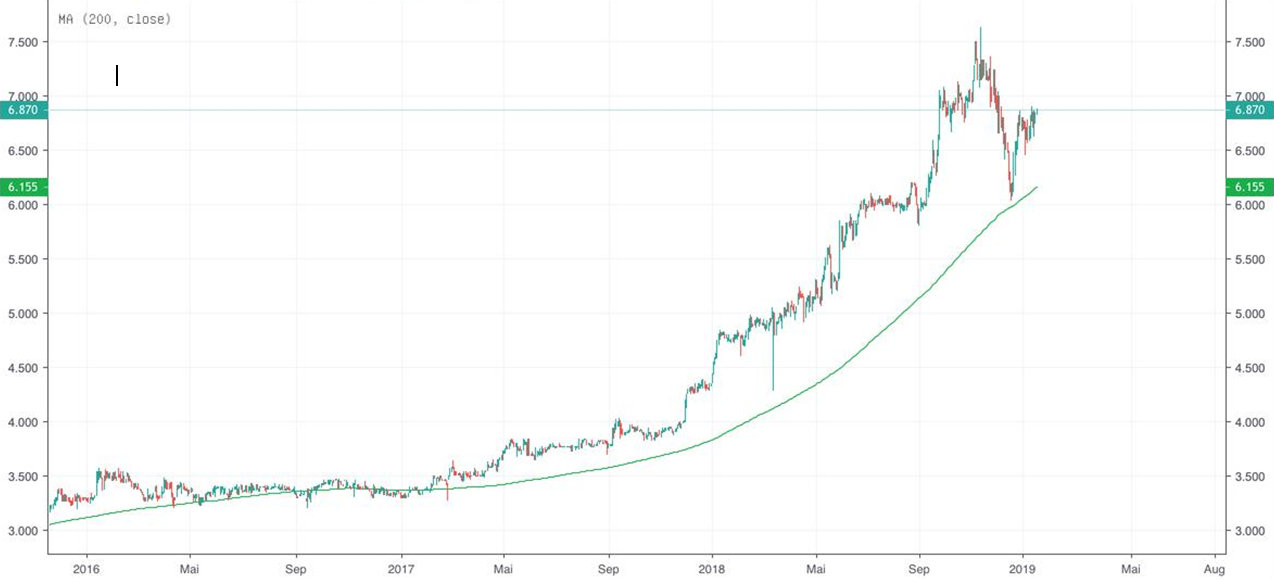
Image 1:
Long term overview (daily chart)
Looking at QL Resources Berhad over a longer period of time, it is clear that the stock is in a long-term upward trend. Since 2017 there has been an enormous price increase.
The SMA 200 is on a steep climb and underlines the strength of the current trend. In the long run, the downward movement of November 2018 is only a correction.
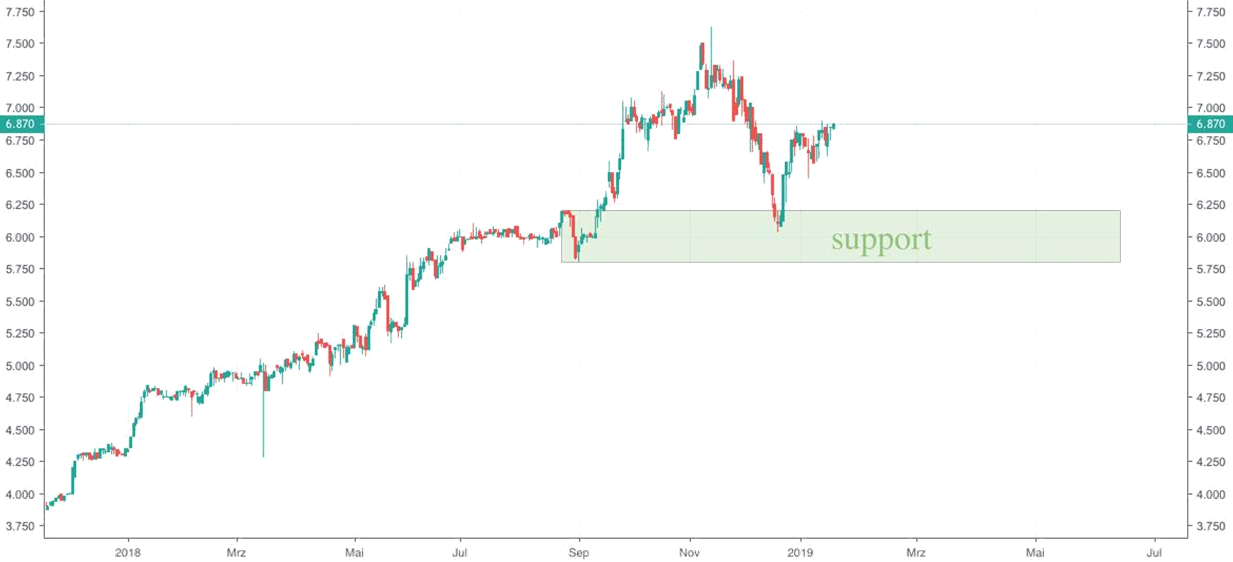
Image 2:
The price corrected in a rapid movement into the last support range between 5.750 - 6.250. This range is also highly relevant in the future. If it is not broken, the uptrend remains intact and further rising prices are very likely.
For an investment over several weeks, the last local high at 7,500 should be the target.
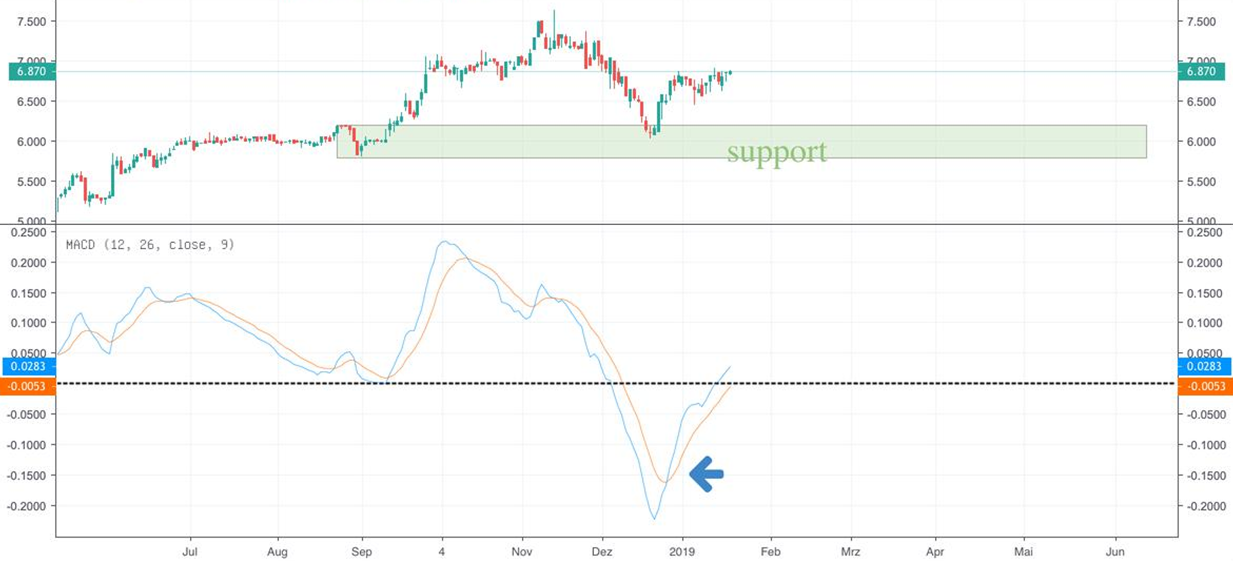
Image 3:
The MACD indicator is also showing a bullish signal. The intersection of the averages has already taken place and the zero line has now been crossed.
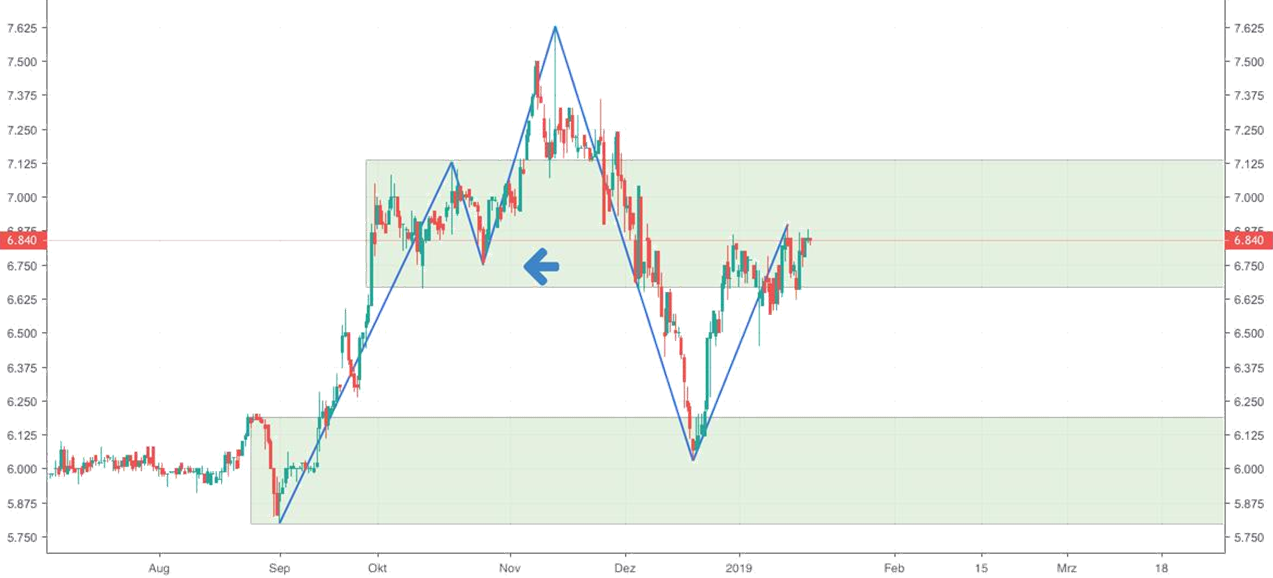
Image 4:
For short-term traders, the last fall in prices is extremely important. A short-term trend break is clearly visible from the 4 hour chart. The last low of the upward trend on H4 is broken and thus the market is trendless in the hourly chart.
Short-term traders should continue to watch until a new trend has clearly emerged.
If a new trend emerges, many market participants can be expected to make an increased appearance and large movements in the direction of the higher trend are possible.
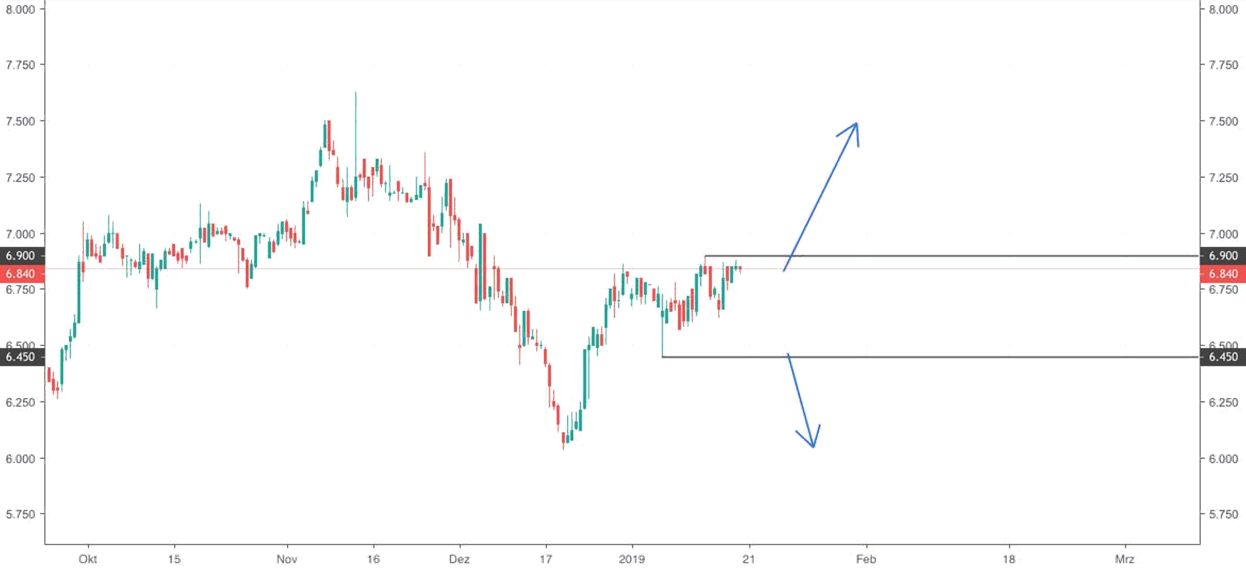
Image 5:
In the last few days the market has been in a range. A breakout from the range is important for the following development of the market. A bearish breakout would likely result in a move to 6.00. A breakout to the up, on the other hand, would move to the 7.250 level.
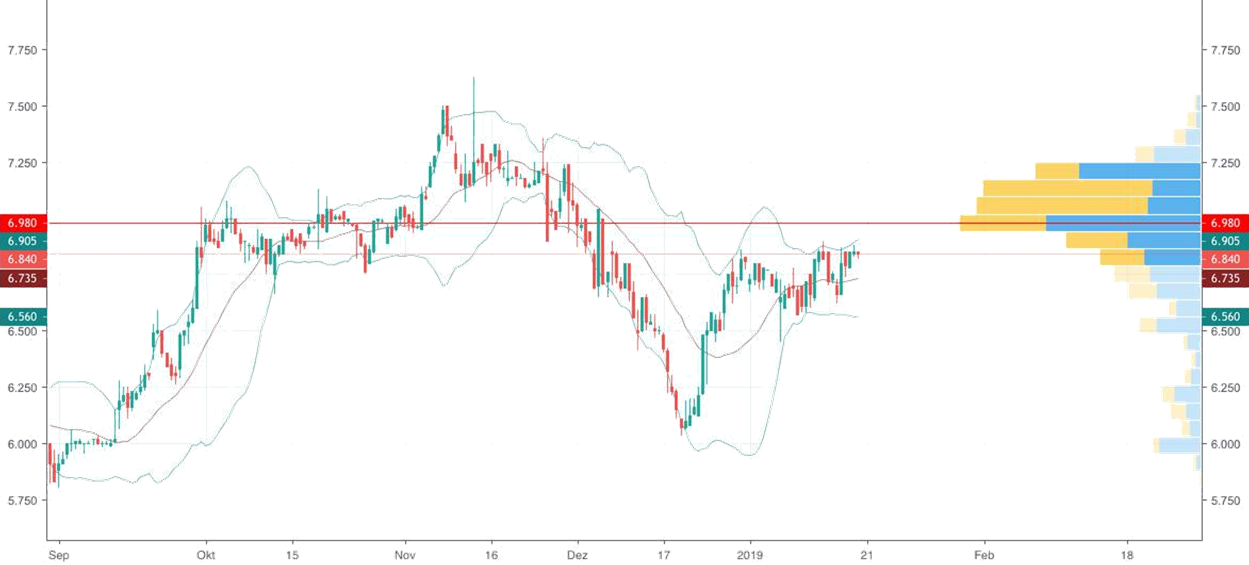
Image 6:
If you take the Bollinger Bands and the Volume Profile for help, the currently unclear situation for short-term traders becomes clear.
The price is close to the point of control, which underlines that there are many orders in the current range. The Bollinger Bands are also tight.
The decisive factor is whether the buyers or sellers assert themselves.
Summary
In the long term, QL Resources Berhad is a clear buyer. However, traders must be aware that there may be short-term price losses. The situation on the hourly chart is and remains unclear and trendless. So short-term traders should not take a position at the moment and wait for a breakout out of the range. If a breakout occurs in the trend direction of the daily chart, a rapid price increase is to be expected. In terms of probability, traders should therefore focus on long positions rather than short positions.
Related Stocks
| Chart | Stock Name | Last | Change | Volume |
|---|
More articles on Sharing News/Announcements & More
Created by ChanZheKang | Jan 24, 2019
Created by ChanZheKang | Jan 21, 2019
Created by ChanZheKang | Jan 21, 2019
Created by ChanZheKang | Jan 21, 2019


supersaiyan3
Head and shoulder.
2019-01-23 04:07