


Candlestick & Breakout Patterns
UCHITEC - From Slow Steady Uptrend To A Momentum Stock

Ming Jong Tey
Publish date: Mon, 02 Jan 2017, 10:10 PM
Ming Jong Tey
0 68
Understand the psychology behind the candlestick & breakout pattern will give you an edge to realize why the market does what it does and anticipate opportunities before they happen!
Get notified on The Next Best Trading & Investing Ideas for free:
Visit ==> http://www.vipplatform.com/lp/ideas/
"Like" FB Page ==> https://www.facebook.com/BursaSGXcandlestick/
"Join" Telegram Channel ==> https://t.me/BursaSGXCandlestick
Get notified on The Next Best Trading & Investing Ideas for free:
Visit ==> http://www.vipplatform.com/lp/ideas/
"Like" FB Page ==> https://www.facebook.com/BursaSGXcandlestick/
"Join" Telegram Channel ==> https://t.me/BursaSGXCandlestick
This analysis is my response to another reader. She asked:
- My view of UCHITEC for long term investment and
- Is now a good time to buy?
I will come back to the questions later.
Let's just head straight to weekly chart below:
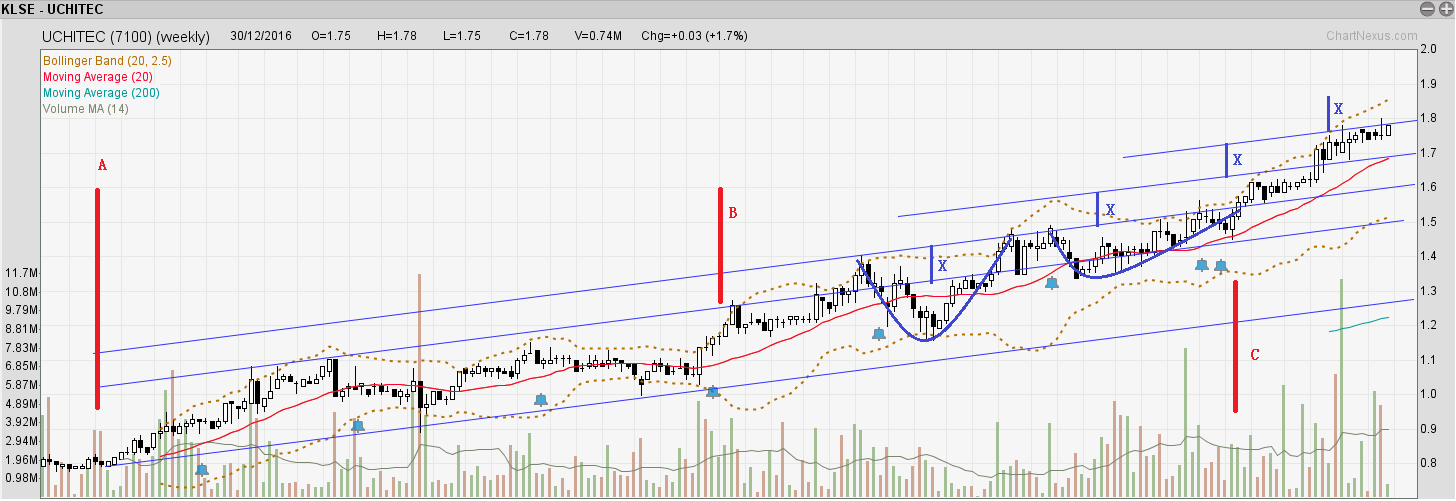
At the first glance, UCHITEC has been on a slow and steady uptrend, as indicated between red line A & B (i.e. duration). The price bouncing within the channel and forming higher high and higher low.
After that we see the price getting a bit momentum to push higher and bouncing along the 2nd channel, as marked between red line B & C.
From red line C onwards, there is bullish momentum was picked up and push to the 3rd channel, and then break up again to enter into the 4th channel.
This is a clear sign that bullish momentum is picking up as we can see that the duration for bouncing within and breaking into the next channels is getting shorter.
There is no other obvious pattern in the chart apart from the rounding bottom patterns as marked in blue.
The projection of the next target price is 1.88 based on equidistance of X, i.e. the width of the channel.
Let's take a look at the daily chart below:
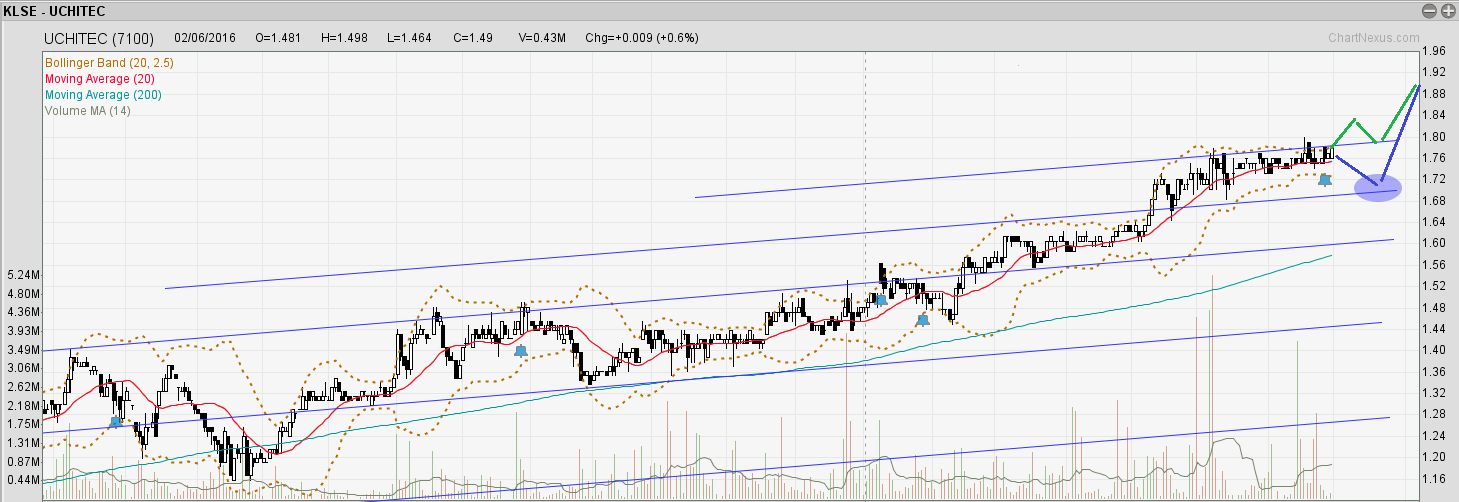
Again, I did not spot any other pattern.
The price hits the upper trendline and there are two possible scenarios:
- Pull back to the lower channel as marked with a blue circle before resuming the bullish momentum to break higher. This is illustrated in the blue path above.
- Break up in the next few days and possible to retest the channel before heading the target price as illustrated in the green path.
So, back to the questions.
Is now a good time to buy? Refer to the two scenarios above. Breakout trader can wait until it breaks above to enter. Else, a low-risk entry might be to wait until it pulls back to the blue circled area.
For long term investment, you will need to do find out based on its fundamental.
From the chart, I noticed that UCHITEC distributes dividend (11 cents) consistently for the past 3 years, which gives a yield of 6% (good dividend stock).
Take a look at the 5 years revenue & profit trend (extracted from malaysiastock.biz) below:
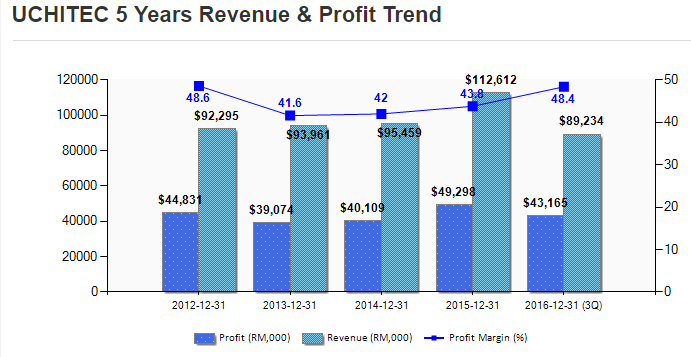
The revenue and profit did not change much from 2012-2014. In 2015, it seems to improve. For 2016, there is a significant improvement in profit since there is 1 more quarter to be added in.
This might be the reason bullish momentum picked up recently as I mentioned earlier on.
For long-term investment, there is a lot more to look for apart from earning and revenue. Check out the balance sheet for cash, look for quality assets, debt, etc...and also cash flow statement.
Find out why the recent quarters' earning improve from the quarterly earning announcement.
Run some numbers to get the ratio you would like to see, ROE, ROIC, P/E, EV/EBIT, etc... and compared with the benchmark.
Eventually, you might want to do a discounted cash flow analysis to find out its intrinsic value and margin of safety.
I wouldn't base solely on the chart for long term investment. Also, I always separate value investing (i.e. long term investment) from trading because the money management for each is totally different.
UCHITEC (7100): Bullish
Pattern: Uptrend Channel
So, there you go.
Topics That You Do Not Want To Miss
How to determine the "bullishness" of the patterns- https://www.facebook.com/BursaSGXcandlestick/videos/378260995905662/
The Trade Management Technique You Need To Know - http://klse.i3investor.com/blogs/candlestick/114496.jsp
Best Way To Learn To Trade Without A Mentor - http://klse.i3investor.com/blogs/candlestick/113821.jsp
Entry Illustration - http://klse.i3investor.com/blogs/candlestick/113605.jsp
Stop Loss & Safe Trading - http://klse.i3investor.com/blogs/candlestick/113510.jsp
Position Sizing - http://klse.i3investor.com/blogs/candlestick/113061.jsp
Come Up With Trading Ideas & Turn Them Into Investing Ideas - http://klse.i3investor.com/blogs/candlestick/114110.jsp
Cheers,
Ming Jong
Get Update From ==> http://www.vipplatform.com/lp/ideas/
& FB page ==> https://www.facebook.com/BursaSGXcandlestick/
Telegram Channel ==> https://t.me/BursaSGXCandlestick
Contact Via Email ==> ![]()
More articles on Candlestick & Breakout Patterns
IQGROUP Rounding Bottom Breakout With A Beautiful Uptrending Channel
Created by Ming Jong Tey | Jun 29, 2017
RCECAP Rounding Bottom Breakout Plus Trending Up Inside A Channel
Created by Ming Jong Tey | May 25, 2017
PENTA Revisit - Rounding Bottom Breakout In A Long-Term Time Frame
Created by Ming Jong Tey | May 21, 2017
Featured Posts
Introducing MY's First IPO Fund for Sophisticated Investors!
New Update. Discover investment communities that resonate with your ideas
M & A Value Partners IPO Equity Fund has been launched - Targeted 13% Return p.a
Latest Videos


Apps


Top Articles
1
CEO Morning Brief
2
3
CEO Morning Brief
4
Good Articles to Share
US Army veteran plows truck into New Orleans crowd - Five stories you need to know | Reuters
5
Good Articles to Share
‘THINGS ARE GETTING WORSE’: Credit card debt skyrocketing to concerning levels #shorts
6
Good Articles to Share
Apple offers iPhone discounts in China as competition intensifies | REUTERS
7
Good Articles to Share
New Orleans, Tesla truck explosion, Gazprom and the debt ceiling
8
#
Stock
Score
Daily Stocks
Stock Name
Last
Change
Volume
Stock Name
Last
Change
Volume
Stock Name
Last
Change
Volume
MQ Trading Signals
Stock
Time
Signal
Duration
Stock
Time
Signal
Duration
Featured Advertisers / Partners


Ride The Bull Short The Bear
CS Tan
4.9 / 5.0
This book is the result of the author's many years of experience and observation throughout his 26 years in the stockbroking industry. It was written for general public to learn to invest based on facts and not on fantasies or hearsay....
cephasyu
Nice, this is good
2017-02-02 18:19