


COMEX Gold Update
Daily Futures Commentaries: [Comex Gold] 1/6/2018 - Gold dipped despite retreat of USD & US stock market

InvestorsDoctor
Publish date: Fri, 01 Jun 2018, 02:15 PM
InvestorsDoctor
0 1,969
To get timely information on local and foreign futures markets, join us on telegram & Facebook.
Join link: https://t.me/investorsdoctoracademy
Facebook: https://m.facebook.com/investorsdoctoracademy/
Join link: https://t.me/investorsdoctoracademy
Facebook: https://m.facebook.com/investorsdoctoracademy/
1/6/2018
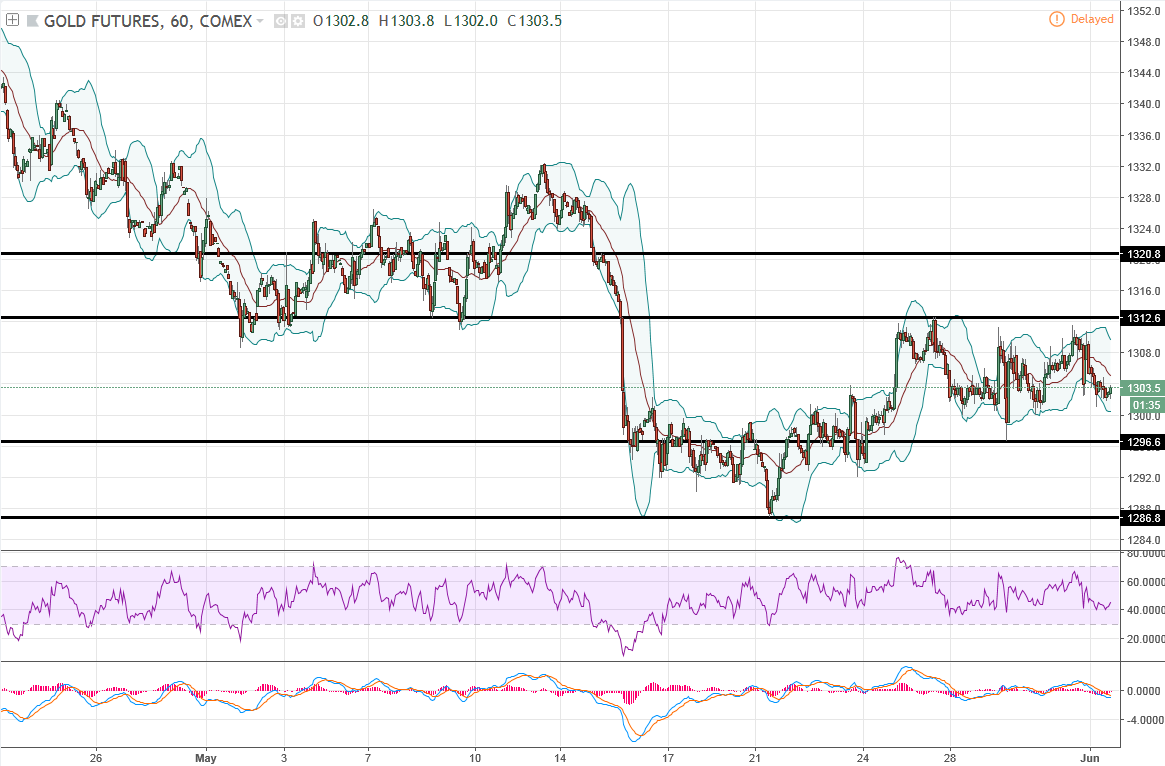
*Gold Aug 18*
Previous Close: 1304.7 -1.8
Gold dropped slightly on yesterday despite a retreat from USD and losses in stock market after US President impose tariffs on metal imports from Canada, Mexico and EU.
Daily chart trade below middle line of BB while MACD & RSI are more to downside, required price to close above 1312.6 to trigger further rebound signal. Hourly chart show gold still in range (1296.6-1312.6), wait for breakout.
*Classic Support & Resistance*
Resistance: 1312.6 1320.8
Support: 1296.6 1286.8
*Recommend Trading Plan for the day:*
1. Trade in range 1296-1313, wait for more breakout signal.
*Margin Requirement (per lot)*
USD 3410
Micro: USD 341
Join our channels to find out more!
Telegram link:
https://t.me/investorsdoctoracademy
Facebook link: https://m.facebook.com/investorsdoctoracademy/
Come and Join us this Sunday (3 June 2018) to learn more about how we can maximize our investment return through futures trading! Limited seats!
Registration link: https://goo.gl/forms/FEoFxff2KFw22JWk1
日期 DATE : 3RD JUNE 2018 (SUNDAY) 6月3日(星期日)
时间 TIME : 10AM - 12PM
地点 VENUE: ShareInvestor Academy No.9, 3rd Mile Square, 151, Batu 3 1/2, Jalan Klang Lama, 58100 KL.
*任何详情,请联络 Any enquiry, please contact us at : 011-53537589 OR investorsdoctoracademy@gmail.com

More articles on COMEX Gold Update
Daily Futures Commentaries: [Comex Gold] 23/12/2019 - Move in range, wait for more breakout
Created by InvestorsDoctor | Dec 23, 2019
Daily Futures Commentaries: [Comex Gold] 20/12/2019 - Move in range, wait for more breakout
Created by InvestorsDoctor | Dec 20, 2019
Daily Futures Commentaries: [Comex Gold] 19/12/2019 - Move in range, wait for more breakout
Created by InvestorsDoctor | Dec 19, 2019
Daily Futures Commentaries: [Comex Gold] 18/12/2019 - Move in range, wait for more breakout
Created by InvestorsDoctor | Dec 18, 2019
Daily Futures Commentaries: [Comex Gold] 17/12/2019 - Move in range, wait for more breakout
Created by InvestorsDoctor | Dec 17, 2019
Discussions
Be the first to like this. Showing 0 of 0 comments
Post a Comment
Featured Posts
New Update. Discover investment communities that resonate with your ideas

Apps


Top Articles
1
https://dividendguy67.blogspot.com
3
4
Good Articles to Share
Could Kamala Harris beat Donald Trump in November's presidential race?
5
Good Articles to Share
Iranian warship capsizes during repairs in port of Bandar Abbas
6
Good Articles to Share
7
Good Articles to Share
Jonathan Turley unveils exciting new book 'Free Speech in the Age of Rage'
8
Good Articles to Share
Why Impossible Foods signed hot dog-eating legend Joey Chestnut #yahoofinance #youtubeshorts
#
Stock
Score
Daily Stocks
Stock Name
Last
Change
Volume
Stock Name
Last
Change
Volume
Stock Name
Last
Change
Volume
MQ Trading Signals
Stock
Time
Signal
Duration
No trading signals available.
Stock
Time
Signal
Duration
No trading signals available.
Featured Advertisers / Partners


Ride The Bull Short The Bear
CS Tan
4.9 / 5.0
This book is the result of the author's many years of experience and observation throughout his 26 years in the stockbroking industry. It was written for general public to learn to invest based on facts and not on fantasies or hearsay....