


COMEX Gold Update
Daily Futures Commentaries: [Comex Gold] 4/6/2018 - Fall after better than expected US economic data

InvestorsDoctor
Publish date: Mon, 04 Jun 2018, 11:48 AM
InvestorsDoctor
0 1,969
To get timely information on local and foreign futures markets, join us on telegram & Facebook.
Join link: https://t.me/investorsdoctoracademy
Facebook: https://m.facebook.com/investorsdoctoracademy/
Join link: https://t.me/investorsdoctoracademy
Facebook: https://m.facebook.com/investorsdoctoracademy/
4/6/2018
*Gold Aug 18*
Previous Close: 1299.3 -5.4
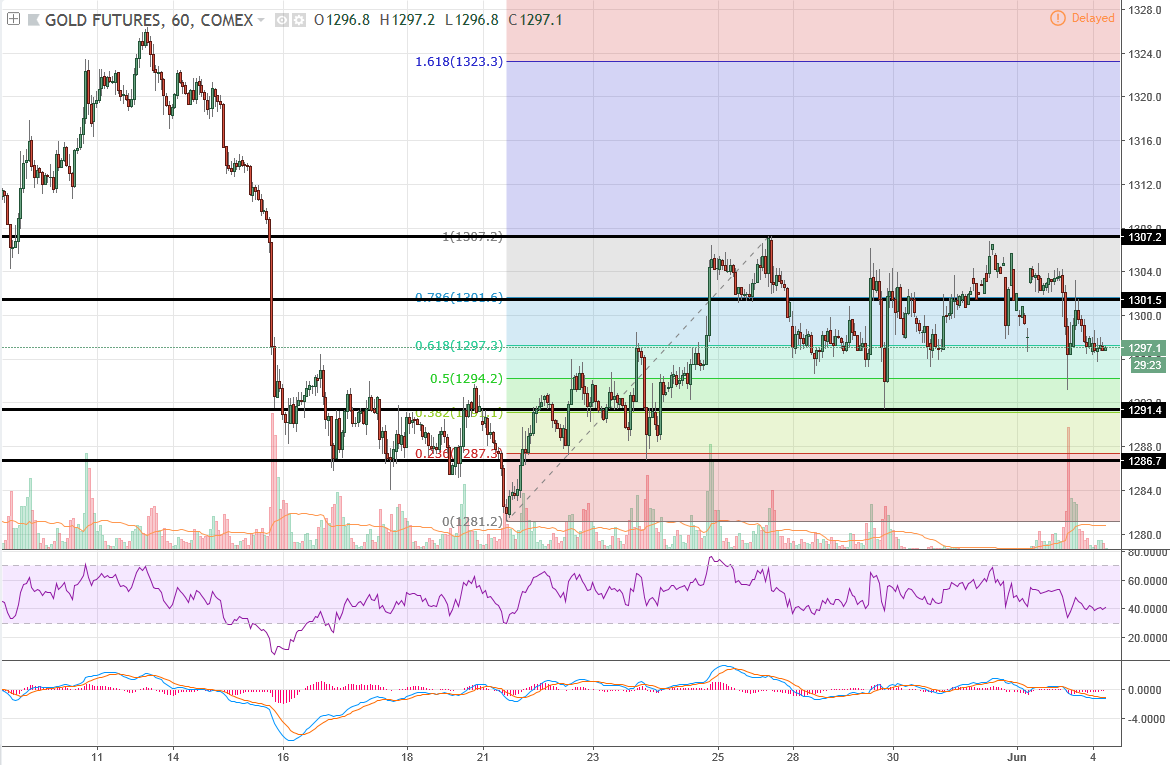
Gold dipped to below 1300 after US payrolls data better than expected pushed USD higher.
Daily chart trade below middle line of BB while MACD & RSI are more to downside, required price to close above 1312.6 to trigger further rebound signal. Hourly chart show gold still in range (1291.4-1307.2), wait for breakout.
*Classic Support & Resistance*
Resistance: 1301.5 1307.2
Support: 1291.4 1286.7
*Recommend Trading Plan for the day:*
1. Look for technical rebound buy signal above 1298.6.
2. Look for sell signal below 1295.7.
*Margin Requirement (per lot)*
USD 3410
Micro: USD 341
Join our channels to find out more!
Telegram link:
https://t.me/investorsdoctoracademy
Facebook link: https://m.facebook.com/investorsdoctoracademy
More articles on COMEX Gold Update
Daily Futures Commentaries: [Comex Gold] 23/12/2019 - Move in range, wait for more breakout
Created by InvestorsDoctor | Dec 23, 2019
Daily Futures Commentaries: [Comex Gold] 20/12/2019 - Move in range, wait for more breakout
Created by InvestorsDoctor | Dec 20, 2019
Daily Futures Commentaries: [Comex Gold] 19/12/2019 - Move in range, wait for more breakout
Created by InvestorsDoctor | Dec 19, 2019
Daily Futures Commentaries: [Comex Gold] 18/12/2019 - Move in range, wait for more breakout
Created by InvestorsDoctor | Dec 18, 2019
Daily Futures Commentaries: [Comex Gold] 17/12/2019 - Move in range, wait for more breakout
Created by InvestorsDoctor | Dec 17, 2019
Discussions
Be the first to like this. Showing 0 of 0 comments
Post a Comment
Featured Posts


Apps


Top Articles
1
https://dividendguy67.blogspot.com
3
4
Good Articles to Share
Could Kamala Harris beat Donald Trump in November's presidential race?
5
Good Articles to Share
Iranian warship capsizes during repairs in port of Bandar Abbas
6
Good Articles to Share
7
Good Articles to Share
Jonathan Turley unveils exciting new book 'Free Speech in the Age of Rage'
8
Good Articles to Share
Why Impossible Foods signed hot dog-eating legend Joey Chestnut #yahoofinance #youtubeshorts
#
Stock
Score
Daily Stocks
Stock Name
Last
Change
Volume
Stock Name
Last
Change
Volume
Stock Name
Last
Change
Volume
MQ Trading Signals
Stock
Time
Signal
Duration
No trading signals available.
Stock
Time
Signal
Duration
No trading signals available.
Featured Advertisers / Partners


Ride The Bull Short The Bear
CS Tan
4.9 / 5.0
This book is the result of the author's many years of experience and observation throughout his 26 years in the stockbroking industry. It was written for general public to learn to invest based on facts and not on fantasies or hearsay....