


COMEX Gold Update
Daily Futures Commentaries: [Comex Gold] 29/6/2018 - Lower low again on strong USD and raising treasury yield

InvestorsDoctor
Publish date: Fri, 29 Jun 2018, 11:19 AM
InvestorsDoctor
0 1,969
To get timely information on local and foreign futures markets, join us on telegram & Facebook.
Join link: https://t.me/investorsdoctoracademy
Facebook: https://m.facebook.com/investorsdoctoracademy/
Join link: https://t.me/investorsdoctoracademy
Facebook: https://m.facebook.com/investorsdoctoracademy/
29/6/2018
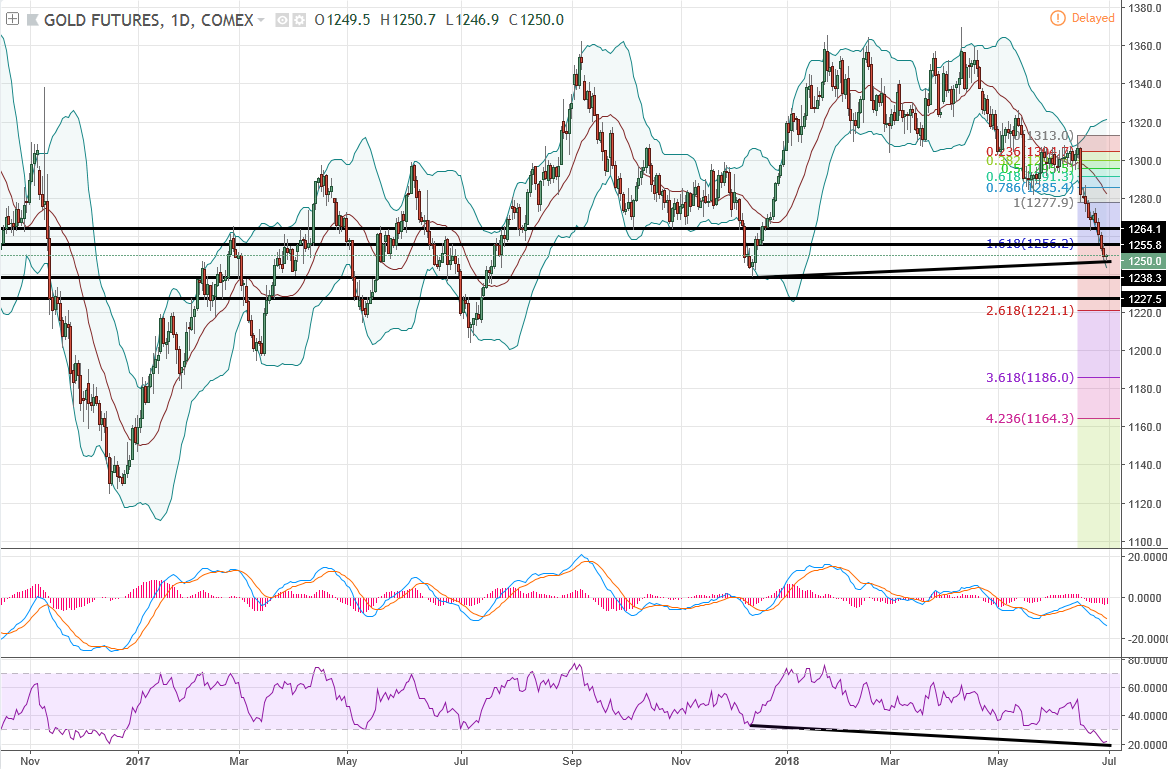
*Gold Aug 18*
Previous Close: 1251 -5.1
Gold fell to its lowest in more than 6 months as USD strengthening and raising treasury yield.
Daily chart show gold more to bearish as technical indicators crossing down while candles formed lower highs & lows, and there is a potential RSI bearish divergence.
*Classic Support & Resistance*
Resistance: 1255.8 1264.1
Support: 1238.3 1227.5
*Recommend Trading Plan for the day:*
1. Buy 1250.8 for technical rebound, stop 1249.1, profit 1252.5/1254.2.
2. look for sell signal if break below 1246.9.
*Margin Requirement (per lot)*
USD 3410
Micro: USD 341
Join our channels to find out more!
Telegram link:
https://t.me/investorsdoctoracademy
Facebook link: https://m.facebook.com/investorsdoctoracademy
Since 14th May 2018 (stock market reopened after 509 GE-14), FKLI Futures dropped nearly 200.5 points from high 1876.5 to recent low 1676!
Simple Calculation:
200.5 x RM 50 per index point = RM 10,025 (Potential Profit!)
Well, NOW is the time for you to understand more about FKLI Trading!
Come & Join us on 14th July 2018 from 2PM to 4PM at SI Academy.
IDA will discover together with You - What is FKLI............
https://goo.gl/forms/SyxDaLNwkuYagkA02
More articles on COMEX Gold Update
Daily Futures Commentaries: [Comex Gold] 23/12/2019 - Move in range, wait for more breakout
Created by InvestorsDoctor | Dec 23, 2019
Daily Futures Commentaries: [Comex Gold] 20/12/2019 - Move in range, wait for more breakout
Created by InvestorsDoctor | Dec 20, 2019
Daily Futures Commentaries: [Comex Gold] 19/12/2019 - Move in range, wait for more breakout
Created by InvestorsDoctor | Dec 19, 2019
Daily Futures Commentaries: [Comex Gold] 18/12/2019 - Move in range, wait for more breakout
Created by InvestorsDoctor | Dec 18, 2019
Daily Futures Commentaries: [Comex Gold] 17/12/2019 - Move in range, wait for more breakout
Created by InvestorsDoctor | Dec 17, 2019
Discussions
Be the first to like this. Showing 0 of 0 comments
Post a Comment
Featured Posts
New Update. Discover investment communities that resonate with your ideas

Apps


Top Articles
1
https://dividendguy67.blogspot.com
3
4
Good Articles to Share
Could Kamala Harris beat Donald Trump in November's presidential race?
5
Good Articles to Share
Iranian warship capsizes during repairs in port of Bandar Abbas
6
Good Articles to Share
7
Good Articles to Share
Jonathan Turley unveils exciting new book 'Free Speech in the Age of Rage'
8
Good Articles to Share
Why Impossible Foods signed hot dog-eating legend Joey Chestnut #yahoofinance #youtubeshorts
#
Stock
Score
Daily Stocks
Stock Name
Last
Change
Volume
Stock Name
Last
Change
Volume
Stock Name
Last
Change
Volume
MQ Trading Signals
Stock
Time
Signal
Duration
No trading signals available.
Stock
Time
Signal
Duration
No trading signals available.
Featured Advertisers / Partners


Ride The Bull Short The Bear
CS Tan
4.9 / 5.0
This book is the result of the author's many years of experience and observation throughout his 26 years in the stockbroking industry. It was written for general public to learn to invest based on facts and not on fantasies or hearsay....