


COMEX Gold Update
Daily Futures Commentaries: [Comex Gold] 10/12/2018 - Bullish but watch out Fibo level at around 1260

InvestorsDoctor
Publish date: Mon, 10 Dec 2018, 10:25 AM
InvestorsDoctor
0 1,969
To get timely information on local and foreign futures markets, join us on telegram & Facebook.
Join link: https://t.me/investorsdoctoracademy
Facebook: https://m.facebook.com/investorsdoctoracademy/
Join link: https://t.me/investorsdoctoracademy
Facebook: https://m.facebook.com/investorsdoctoracademy/
10/12/2018
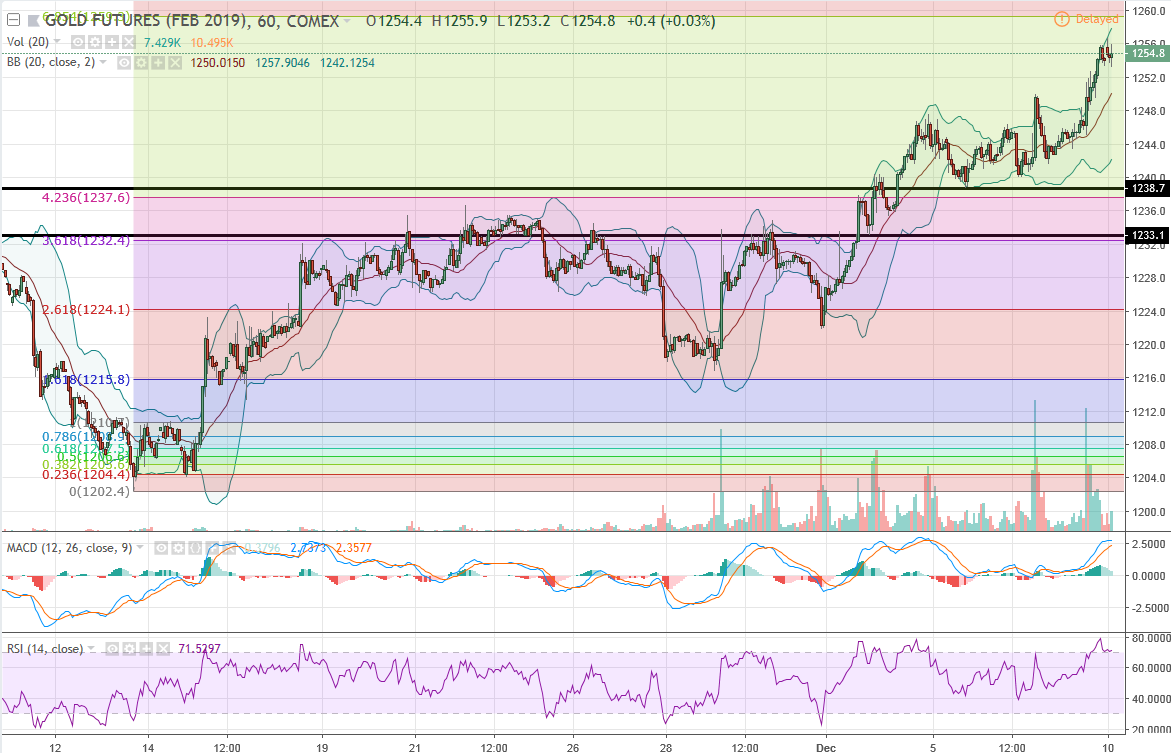
*Gold Feb 19*
Previous Close: 1252.6 +9
Gold hit a 5 month high on last Friday as USD slid following weaker-than-expected US jobs data that raised the possibility that the Federal Reserve might go slow on interest rate hikes next year.
Hourly chart formed a more to bullish trend with higher highs & lows, but watch out for Fibo level around 1260 and RSI in overbought.
*Classic Support & Resistance*
Resistance: 1265.4 1284.1
Support: 1238.7 1233.1
*Recommend Trading Plan for the day:*
1. Look for buy signal above 1256.6.
*Margin Requirement (per lot)*
USD 3740
Micro: USD 374
Disclaimer: Idea sharing only, trade at your own risk.
Please SHARE & SUBSCRIBE our YOUTUBE channel for latest FREE videos !!!
https://www.youtube.com/channel/UCnOB_UmIXe3OTE2SgiK9kpg
Join our other channels to find out more about futures trading !!!
Telegram link:
https://t.me/investorsdoctoracademy
Facebook link:
https://m.facebook.com/investorsdoctoracademy
More articles on COMEX Gold Update
Daily Futures Commentaries: [Comex Gold] 23/12/2019 - Move in range, wait for more breakout
Created by InvestorsDoctor | Dec 23, 2019
Daily Futures Commentaries: [Comex Gold] 20/12/2019 - Move in range, wait for more breakout
Created by InvestorsDoctor | Dec 20, 2019
Daily Futures Commentaries: [Comex Gold] 19/12/2019 - Move in range, wait for more breakout
Created by InvestorsDoctor | Dec 19, 2019
Daily Futures Commentaries: [Comex Gold] 18/12/2019 - Move in range, wait for more breakout
Created by InvestorsDoctor | Dec 18, 2019
Daily Futures Commentaries: [Comex Gold] 17/12/2019 - Move in range, wait for more breakout
Created by InvestorsDoctor | Dec 17, 2019
Discussions
Be the first to like this. Showing 0 of 0 comments
Post a Comment
Featured Posts


Apps


Top Articles
1
https://dividendguy67.blogspot.com
3
4
Good Articles to Share
Could Kamala Harris beat Donald Trump in November's presidential race?
5
Good Articles to Share
Iranian warship capsizes during repairs in port of Bandar Abbas
6
Good Articles to Share
7
Good Articles to Share
Jonathan Turley unveils exciting new book 'Free Speech in the Age of Rage'
8
Good Articles to Share
Why Impossible Foods signed hot dog-eating legend Joey Chestnut #yahoofinance #youtubeshorts
#
Stock
Score
Daily Stocks
Stock Name
Last
Change
Volume
Stock Name
Last
Change
Volume
Stock Name
Last
Change
Volume
MQ Trading Signals
Stock
Time
Signal
Duration
No trading signals available.
Stock
Time
Signal
Duration
No trading signals available.
Featured Advertisers / Partners


Ride The Bull Short The Bear
CS Tan
4.9 / 5.0
This book is the result of the author's many years of experience and observation throughout his 26 years in the stockbroking industry. It was written for general public to learn to invest based on facts and not on fantasies or hearsay....