


COMEX Gold Update
Daily Futures Commentaries: [Comex Gold] 29/1/2019 - Sustain above 1300 level, bullish but watch out for potential RSI bearish divergence

InvestorsDoctor
Publish date: Tue, 29 Jan 2019, 10:56 AM
InvestorsDoctor
0 1,969
To get timely information on local and foreign futures markets, join us on telegram & Facebook.
Join link: https://t.me/investorsdoctoracademy
Facebook: https://m.facebook.com/investorsdoctoracademy/
Join link: https://t.me/investorsdoctoracademy
Facebook: https://m.facebook.com/investorsdoctoracademy/
29/1/2019
*Gold Apr 19*
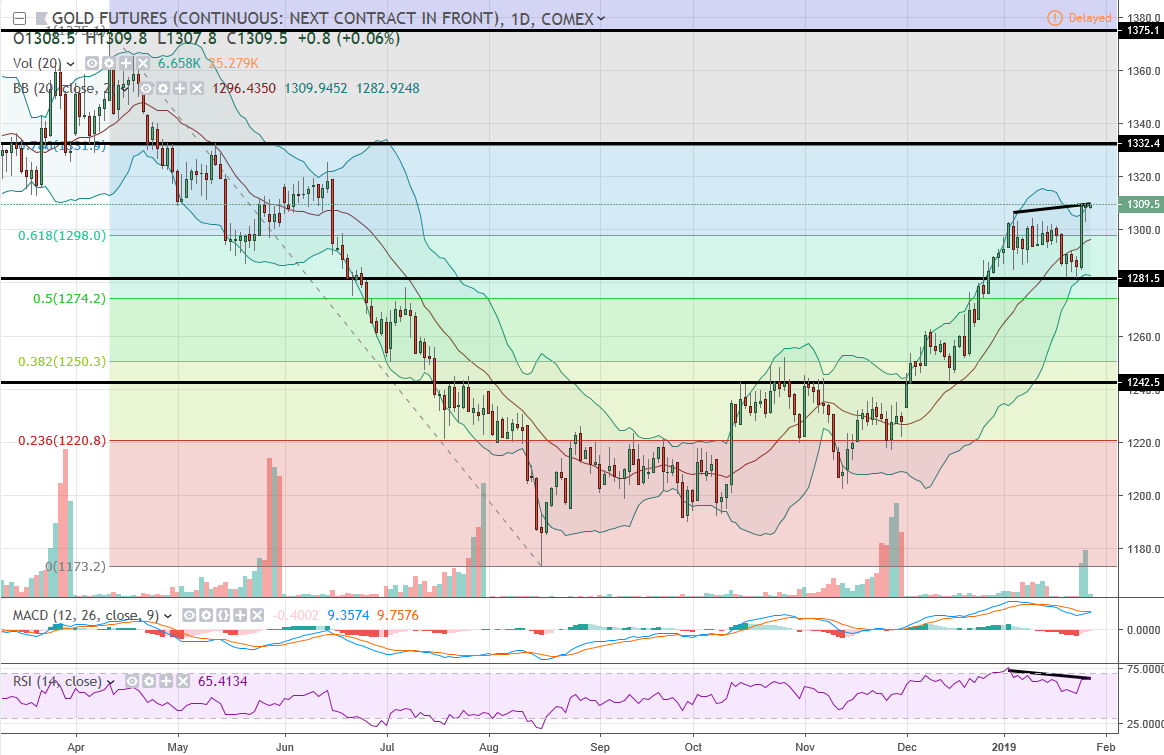
Previous Close: 1309.3 +0.8
Gold was little changed yesterday as there is not much movement in USD but sustain at high on the back of weak stock market.
Daily chart showed gold sustain above long white candle bullish signal, which is also above 61.8 Fibo retracement level of swing 1375.1-1173.2, look for buy setup but trade with cautious as upside may limited by potential RSI bearish divergence.
*Classic Support & Resistance*
Resistance: 1332.4 1375.1
Support: 1281.5 1242.5
*Recommend Trading Plan for the day:*
1. Buy 1310, stop 1308.5, profit 1311.5/1313/1314.5.
2. Look for sell signal below 1301.8.
*Margin Requirement (per lot)*
USD 3740
Micro: USD 374
Disclaimer: Idea sharing only, trade at your own risk.
Please SHARE & SUBSCRIBE our YOUTUBE channel for latest FREE futures trading videos !!!
https://www.youtube.com/channel/UCnOB_UmIXe3OTE2SgiK9kpg
Join our FREE channels to find out more on futures trading !!!
Telegram link:
https://t.me/investorsdoctoracademy
Facebook link:
https://m.facebook.com/investorsdoctoracademy
Or reach out to our contact number +601153537589


More articles on COMEX Gold Update
Daily Futures Commentaries: [Comex Gold] 23/12/2019 - Move in range, wait for more breakout
Created by InvestorsDoctor | Dec 23, 2019
Daily Futures Commentaries: [Comex Gold] 20/12/2019 - Move in range, wait for more breakout
Created by InvestorsDoctor | Dec 20, 2019
Daily Futures Commentaries: [Comex Gold] 19/12/2019 - Move in range, wait for more breakout
Created by InvestorsDoctor | Dec 19, 2019
Daily Futures Commentaries: [Comex Gold] 18/12/2019 - Move in range, wait for more breakout
Created by InvestorsDoctor | Dec 18, 2019
Daily Futures Commentaries: [Comex Gold] 17/12/2019 - Move in range, wait for more breakout
Created by InvestorsDoctor | Dec 17, 2019
Discussions
Be the first to like this. Showing 0 of 0 comments
Post a Comment
Featured Posts
New Update. Discover investment communities that resonate with your ideas

Apps


Top Articles
1
https://dividendguy67.blogspot.com
3
4
Good Articles to Share
Could Kamala Harris beat Donald Trump in November's presidential race?
5
Good Articles to Share
Iranian warship capsizes during repairs in port of Bandar Abbas
6
Good Articles to Share
7
Good Articles to Share
Jonathan Turley unveils exciting new book 'Free Speech in the Age of Rage'
8
Good Articles to Share
Why Impossible Foods signed hot dog-eating legend Joey Chestnut #yahoofinance #youtubeshorts
#
Stock
Score
Daily Stocks
Stock Name
Last
Change
Volume
Stock Name
Last
Change
Volume
Stock Name
Last
Change
Volume
MQ Trading Signals
Stock
Time
Signal
Duration
No trading signals available.
Stock
Time
Signal
Duration
No trading signals available.
Featured Advertisers / Partners


Ride The Bull Short The Bear
CS Tan
4.9 / 5.0
This book is the result of the author's many years of experience and observation throughout his 26 years in the stockbroking industry. It was written for general public to learn to invest based on facts and not on fantasies or hearsay....