


Future Potential of Petronm
Future Potential of Petronm (Part 3)

davidtslim
Publish date: Tue, 11 Jul 2017, 01:23 PM
Petronm Future Potential (Part 3)
Listed Downstream Companies in Bursa and a Comparative Study
There are 3 listed Oil downstream players in Bursa Malaysia namely Petronm, Hengyuan and Petdag.
1. Hengyuan (HY) is a listed refinery company owned by Shandong Hengyuan Petrochemical company limited, China. It bought over 51% shares from Shell refinery Malaysia in Dec 2016 for RM300 mil.
2. Petdag is Malaysia’s leading retailer and marketer of downstream oil and gas products where its products are available at more than 1,000 PETRONAS stations nationwide. (Petronas refinery biz is not listed)
3. Petronm details can refer to http://klse.i3investor.com/blogs/david_petronm/127344.jsp
As I mentioned before two important metrics of a company quality of earning for a companies are dividend and Free Cash Flow generation from operation (other than net profit). Let see the following graphs for HY and Petdag as below:
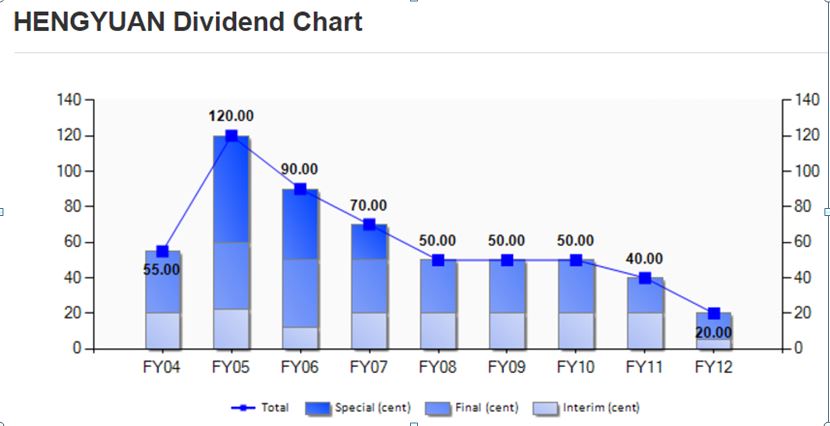
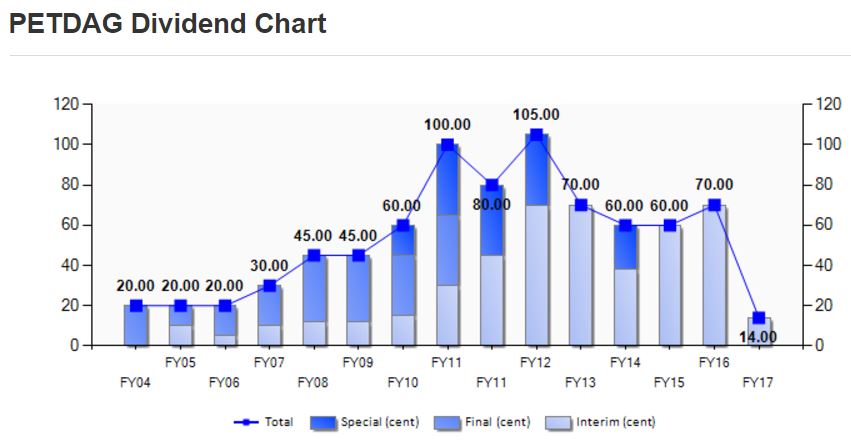
As we can see from the charts, HY stopped paying dividend since 2013 while Petdag has been paying decent dividend (DY of 2.9%) for the past 13 years. Petdag paying dividend on quarterly basis while Petronm paying dividend (DY of 2.8%) on yearly basis. The reason for HY stopped paying dividend maybe due to its high committed capital expenditure (RM700 mil) and high level of debt.
The following two charts show the profit comparison for HY and Petdag:
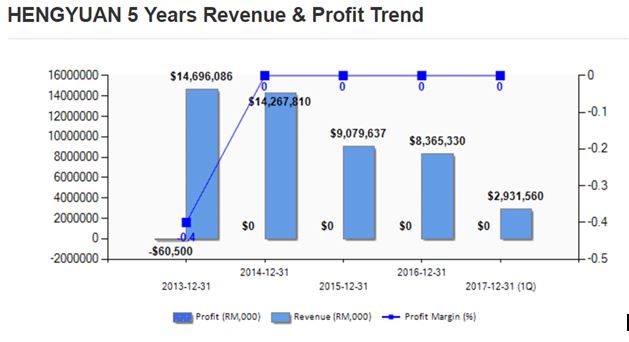
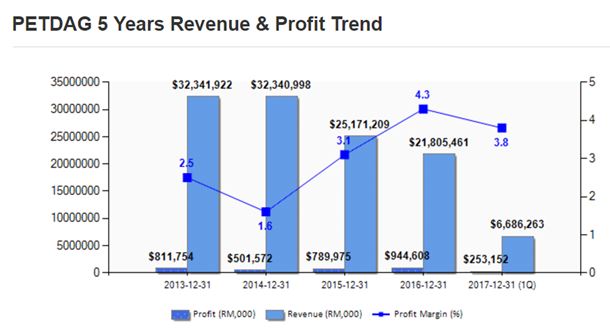
Petdag shows a consistent profit of about EPS 90 sen to 99 sen over the last two years (3 recent YoY improvements), while HY produces 171 sen EPS (Profit before tax). HY can be exempted of paying income tax is due to utilisation of tax losses / deductible temporary. If we consider about 26% tax, then EPS of HY will be around 126.5 sen (trailing 12 months, very low PE).
Petronm generates an EPS of 122 sen for trailing 12 months (refer http://klse.i3investor.com/blogs/david_petronm/127344.jsp)
The following table shows comparisons of the 3 companies based on 5 metrics:
|
|
Dividend |
FCF (free cash flow from operation) |
Total Borrowing |
Cash in Hand |
Return on Equity (ROE) |
|
Petronm (RM7.77) |
22 sen (2.8% yield) |
424 mil (2016) 130 mil (Q1’17) |
251 mil(Q1’17) |
205 mil |
25.89% |
|
Petdag (RM23.9) |
72 sen (2.9% yield) |
1,984mil (2016) 194 mil (Q1’17) |
105 mil(Q1’17) |
2,323 mil |
18.6% |
|
Hengyuan (RM5.55) |
- |
117.4 mil (2016, under Shell) 6.9mil (Q1’17, HY) |
1,414 mil (Q1’17) |
285 mil |
-(NA) |
Source: Q4’16 and Q1’17 reports of the 3 companies
It can be observed that Petronm and Petdag have a relatively healthier balance sheet as compared to Hengyuan mainly due to both of them have much lower borrowings and stronger FCF capability than Hengyuan.
In term of ROE, Petronm produces the highest percentage among the three. ROE is a measure of company's profitability by revealing how much profit a company generates with the money of shareholders have invested.
Let see another comparison among these 3 for number of oil selling volume as below:
|
|
Mil Barrels in Q1’17 |
Million Barrels in 2016 |
Million barrels in 2015 (12 months) |
Loyalty members |
No of stations |
|
Petronm (RM7.77) |
8.3 ( 8.2 in Q1’16) |
32.1 |
30.4 |
4 mil++ (AR 2016) 2 mi++ only in 2015 (AR) |
598 |
|
Petdag (RM23.9) |
Barrel info not available, sales volume dropped by 4%. YoY |
Barrel info not available, sales volume increased by 4% compared to 2015 |
Barrel info not available |
No info |
Over 1000 |
|
Hengyuan (RM5.55) |
10.1 (10.4 in Q1’16) |
39.0 (under Shell) |
36.3 (under Shell) |
NA |
NA |
One can notice that Petronm recorded increase in sales volume (million barrels) (2016 vs 2015) and QoQ (Q1’17 vs Q1’16) (8.3 vs 8.2) while Petdag showed increase in sales volume by 4% (2016 vs 2015) but decrease in QoQ (Q1’17 vs Q1’16) also by 4%.
HY recorded a drop of sales volume by QoQ (10.1 Q1’17 vs 10.4 Q1’16) when recorded an increase of sales volume (2016 vs 2015) under former Shell brand name.
Both Petronm and Petdag recorded a strong double digit growth in their commercial fuel segment mainly involve Jet fuel in LPG products.
Review of Petronm’s Fair Value
Due to Petronm’s businesses consist of both refinery and petroleum products retails, it can be view as it is a combination (hybrid) of HengYuan and Petdag where only has refinery and retails business respectively. Of course, its size of refinery and retails is about 50% smaller than HY and Petdag.
From recent monitoring of refinery margin or crack spread, one can observe that refinery margin is maintained near to its highest level in the past 5 years (http://timesofindia.indiatimes.com/business/international-business/asia-distillates-cash-differentials-slip-cracks-hold-firm/articleshow/59528955.cms?from=mdr).
Retails business provides a steady cash flow and stable income for Petronm, while its strong growth and profit catalyst can be come from refinery segment. Retails provide a defensive business where refinery and commercial retails segment (30% contribution) can bring the company to have double digit growth in future quarter profit. In Chinese we can describe Petronm as 攻守兼备where retails is for守and refinery is for 攻。
From my previous article (https://klse.i3investor.com/blogs/david_petronm/127424.jsp), one can notice that Petronm refinery throughput is still estimated to run at 48kbpd (based on past data). It is still far from its max daily capacity of 88kbpd.
I would say once Petronm manage to increase its throughput to 80% of max capacity, then significant profit growth from refinery segment is not a dream.
The reason why Petronm run its refinery capacity maybe due to the modification done is to handle crude of higher sulfur content which is much cheaper than the sweeter crude oil (lower sulfur). Lower capacity of its throughput maybe due to its Hydrotreater installed is for further purification of gasoline or diesel to meet the Euro 4 requirement.
Recent higher refinery margin of Jet fuel (at 12 USD) may give motivation to Petronm to increase its capacity to produce more Jet fuel from low sulfur crude oil
Let revisit the profit estimation table as in my first article (https://klse.i3investor.com/blogs/david_petronm/127344.jsp)
2016 (actual) and 2017 (estimated) Quarters Profit
|
|
2016 (mil, EPS in sen) |
2017 (mil, EPS in sen) |
|
Q1 |
16.61, 6.15 |
108.54, 40.2 |
|
Q2 |
61,53, 22.79 |
estimated (~100.2,~ 37) |
|
Q3 |
46.79, 17.33 |
estimated by 90% from Q1’17 profit(~97.69, ~36.18) |
|
Q4 |
112.62, 41.71 |
estimated by 95% from Q1’17 profit (~103.1, ~38.2) |
|
Total |
237.5, 87.98 |
estimated (~409.53, ~151.6) |
*Q4 normally is the peak of the season and Q1 is the weak season
I adjusted the estimated profit for Q3’2017 to 90% from previous 80% is due to high refinery profit, slow growing retail business and possible strong growth from commercial segment.
For Q4’2017 profit forecast, I adjusted to 95% from Q1’2017 due to Q4 is normally peak season for Petronm as more holidays fall in Q4 which resulted higher number of travelling.
With estimated EPS of 151.6 sen (RM409 mil profit) for FY2017, fair forward PE for Petronm should be in the range of 7.5 to 9. With PE of 7.5, the fair value of Petronm should be RM11.37 while at high side of PE, Petronm possible to be valued at RM13.64
Key Catalyst: Significant profit contribution from Refinery segment (蓄势待发 )
Summary
1. The nature of petroleum product retails business is low risk in term of receivable as all petrol station business are performed in cash or credit card. Another customer for Petronm under APM system where the payer is government. As a result, there is low risk of bad debt and impairment.
2. However, the risk involve will be big fluctuation of Crude oil price which affect its feedstock cost for refinery. This can be minimized by hedging using derivative (50% hedge and the rest is natural hedge from export revenue). It is worth noting that Crude oil price dropping should reduce its feedstock cost and also is capital needed to buy the stock.
3. It is up to market what fair value to price for Petronm but with decent dividend, future earning visibility and healthy balance sheet, Petronm is a medium cap counter deserves some attention for investors who looking for stable retails and strong growth of refinery business.
4. To make profit from share investment, one of the practices is BUY good company at cheap price and SELL it when it is fully value. It is up to market to evaluate whether Petronm is a good company at cheap price or not.
You can get my latest update on share analysis at Telegram Channel ==> https://t.me/davidshare
Disclaimer:
This writing is my own imagination for all the assumptions and estimations. It is strictly for sharing purpose, not a buy or sell call of the company.
Related Stocks
| Chart | Stock Name | Last | Change | Volume |
|---|
More articles on Future Potential of Petronm
Discussions
10 people like this. Showing 11 of 11 comments
including the 'breed of the honey bee'...i.e, what kind of honey it makes..
2017-07-11 14:38
But raider says for 2015, 2016 full year and 1st qtr 2017 Hengyuan ROE is higher than Petron loh...!!
Other than above correction, this is a very good write up loh..!!
2017-07-12 12:31
Posted by Icon8888 > Jul 12, 2017 12:44 PM | Report Abuse
https://klse.i3investor.com/blogs/icon8888/127661.jsp
2017-07-12 12:54
Hi dividtslim thks for sharing. Hope can read more of your good reports in future.
2017-07-12 14:09
dividtslim, noted from table on comparisons of 3 companies based on 5 metrics you stated FCF for Petronm - 424M (2016) and 130M (Q1 17) you help to clarify definition of :-
1) FCF
2) Cash on Hand.
Thks.
2017-07-15 00:04
Post a Comment
Featured Posts


Latest Videos


Apps


Top Articles
1
2
4
save malaysia!
Visa-free travel to China extended for Malaysians to 30 days
5
6
7
BFM Podcast
8
#
Stock
Score
Daily Stocks
Stock Name
Last
Change
Volume
Stock Name
Last
Change
Volume
Stock Name
Last
Change
Volume
Featured Advertisers / Partners


Ride The Bull Short The Bear
CS Tan
4.9 / 5.0
This book is the result of the author's many years of experience and observation throughout his 26 years in the stockbroking industry. It was written for general public to learn to invest based on facts and not on fantasies or hearsay....
Newmaster
Good work, valuable information
2017-07-11 13:40