


Hau To Invest (Malaysia)
SCGM: “Sure Can” Growth Model

HauToInvest
Publish date: Mon, 05 Jun 2017, 07:51 PM
HauToInvest
0 8
This blog is for serious value investors. I select some relevant articles to post here. If you have interest to read my other articles, please visit www.hautoinvest.com
When we consume packaged food and drinks, we seldom notice the manufacturers of the packaging and their businesses. SCGM Bhd (SCGM:KLS, stock code: 7247) are factories in Malaysia that process input materials such as PET, PP and transform them into consumer products in food packaging. SCGM is a very typical Malaysian founder-operated business that started almost from scratch to eventually listed in the main market in KLSE. Here is a nice corporate milestones captured from its annual report 2016.

Family Lee has four brothers who are all executive directors. They have an ambitious production capacity expansion plan for the next three years. What if they could successfully execute their plan? How would its sales and net profits play out in future? Has the current PE multiple 26 already fully capitalize its growth potential?
Which growth model is useful to SCGM valuation?
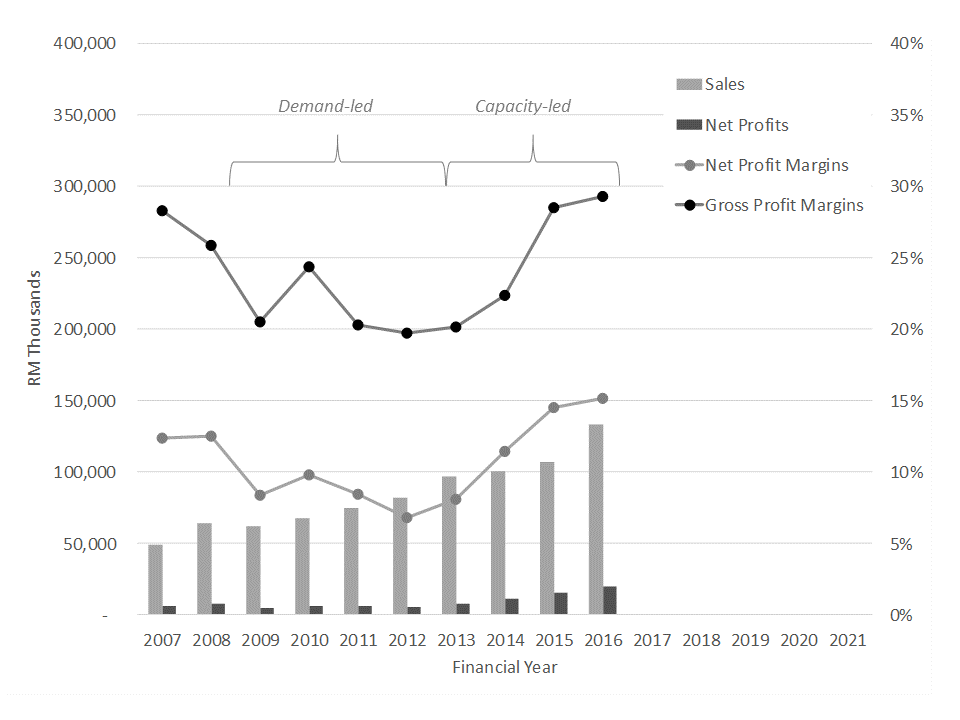
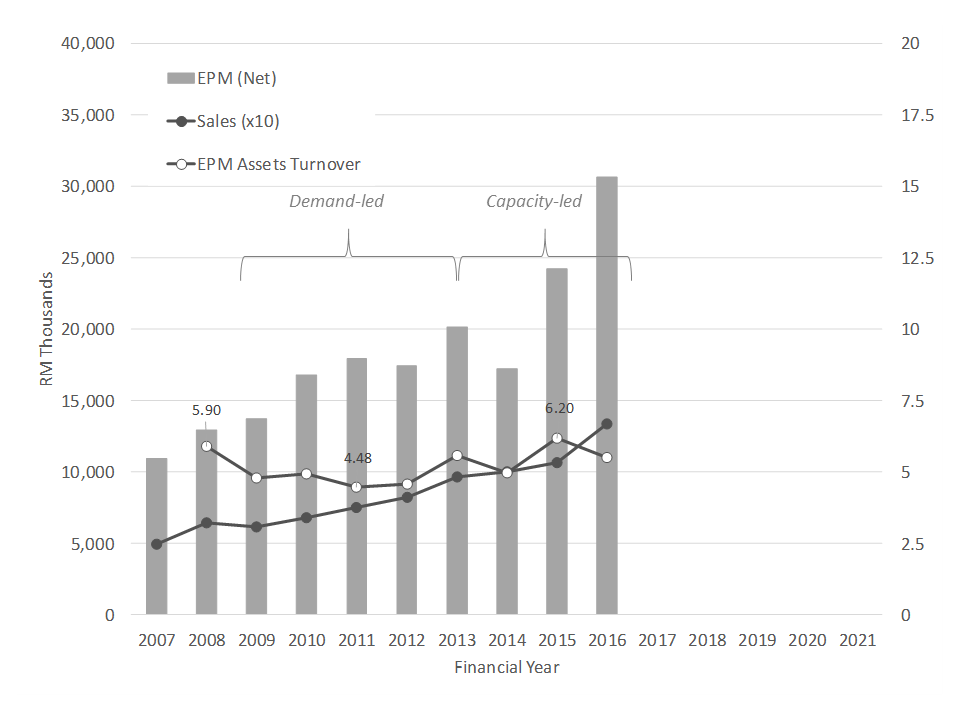
One need to know the growth model of SCGM before estimating its future growth. If the growth model is demand-led, it means the limiting factor to growth is sales; if it is production capacity-led, then the limiting factor to growth is production capacity. Let’s firstly examine the historical growth pattern of SCGM in the past ten years. The 1st chart shows sales and gross profit margins in the past ten financial years[1]. With the global financial crisis as background in 2008, demand shrank significantly within a year; sales declined by 5% in FY2009. However, the production capacity of the packaging industry was inelastic in such short time, resulting in significant over-capacity and great pressure on gross profit margins. Except some inventory re-stocking phenomenon in FY2010, the gross profit margins remained low at around 20% till FY2013. To see more evidences of changing growth pattern in FY2013, let’s examine the 2nd chart that shows SCGM’s EPM (Equipment, Plant and Machinery) assets turnover. By definition, EPM assets turnover tells us how much sales is generated per EPM assets (measured at the beginning of financial year[2]); if EPM assets are fully utilized in given financial year, the corresponding EPM assets turnover should be the highest and vice versa. In FY2009, EPM assets turnover drastically dropped, reflecting low EPM utilizations. The lowest point came at 4.48 in FY2011.
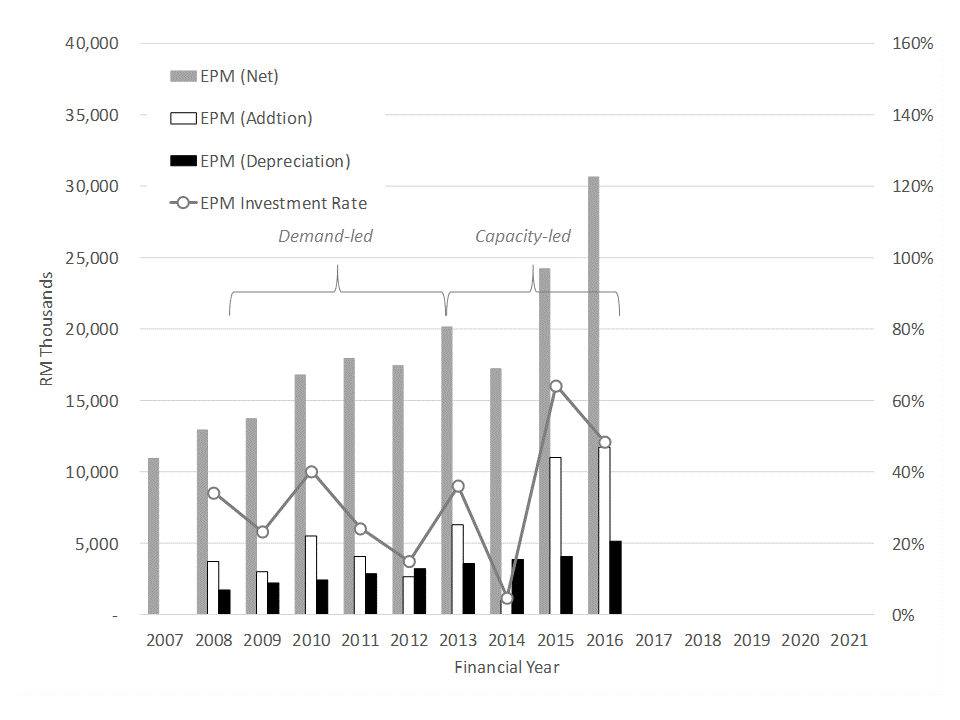
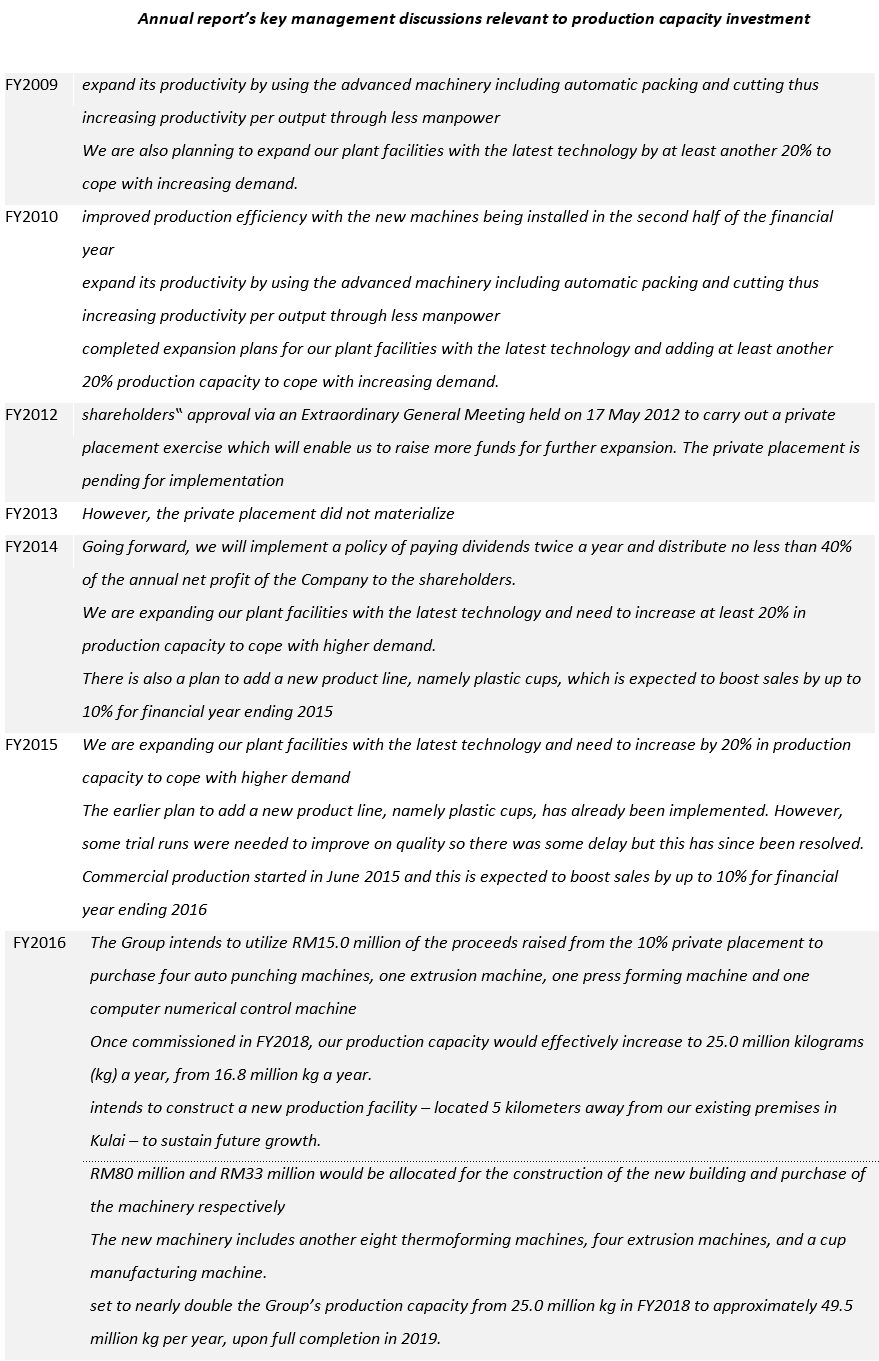
Based on these gross profit margins and EPM assets turnover trends, I will argue that from roughly FY2009 to FY2013, SCGM experienced a demand-led growth period. No matter how much EPM could SCGM possibly add, it could not increase sales without sacrificing gross profit margin. Since around FY2013, however, I will argue SCGM’s growth path has increasingly become capacity-led. EPM assets turnover was on the rising trend, with maximum at 6.2 in FY2015. EPM (net) has also been expanding faster in the same period. The 3rd chart details how much EPM was added and depreciated over time. EPM investment rate shows a consistent trend of low investment rate during demand-led period and rising investment rate during capacity-led period[3]. We may obtain more insights from the management discussions. Particularly in FY2012, the board intended to “carry out a private placement exercise which will enable us to raise more funds for further expansion”. Although it did not materialize immediately, the board eventually completed the private placement of 10% of new ordinary shares in FY2016, raising RM31.3m to fund its expansion plan; the size of this new equity capital is almost the same as that of the sum of EPM additions during FY2012 to FY2016. Otherwise, SCGM should have seen more expansion in the past three years.
Given fore-mentioned analysis and the management expansion plan committed so far, I will assume production capacity be the limiting factor of growth in the next three to five years. In other words, capacity-led growth model should be more useful for SCGM valuation in medium investment time frame (3 to 5 years).
The capacity-led growth model
Under the capacity-led situation, SCGM were as if it is the only fishing boat in the ocean; it catches fishes as much as it can. The only limitation[4] is its capacity to catch. The core productive assets of SCGM is EPM, so the capacity of EPM is the limiting factor to sales growth; and the capacity of EPM is represented by EPM assets in monetary unit (RM). In mathematical expression,
EPM assets (net) * EPM assets turnover = Sales
where EPM assets (net, in RM) are measured at the beginning of financial year and EPM assets turnover is a multiple; both are independent inputs that determines sales as an output. Assuming a constant EPM assets turnover, the growth of sales is directly proportional to the growth of EPM assets. By contrast, under the demand-led situation, expanding EPM assets does not translate into growth of sales because demand is the limiting factor.
To facilitate an interactive valuation experience, the financial model of SCGM and the investment valuation model are programmed in Stella® Architect by isee systems inc. The models require the following inputs to compute the present value of SCGM shares:
-
Inputs to SCGM financial model
- Net profit margin
- EPM investment rate
- EPM depreciation rate
- EPM assets turnover
- Dividend payout ratio
-
Inputs to investment valuation model
- Holding period
- Expected PE multiple when selling SCGM shares
- Required rate of return
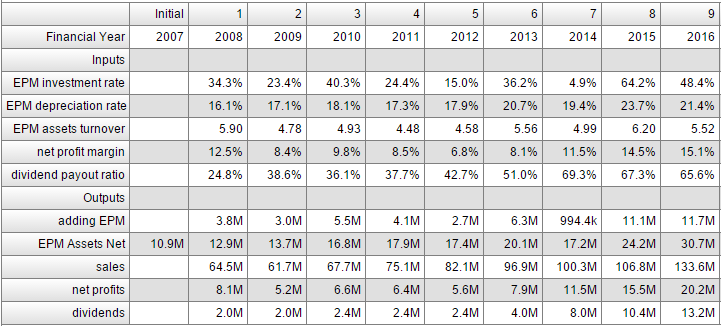
Using this model and user-defined inputs, we can simulate the present value of all SCGM shares by discounting all cash dividends received and proceeds of selling all shares during the holding period. The financial model of SCGM are validated by its historical financial data from FY2007 to FY2016 as shown in the table. Note that the initial (FY2007) value of EPM (net) is in fact an input.
Hau’s view
Now I’m ready to simulate “What if” scenario to conclude my investment case in SCGM. Based on my gut feeling, I assume the following inputs to SCGM financial model in the next five years.
Net profit margin:
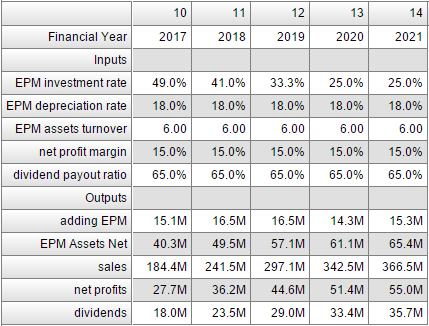
I take the same margin from FY2016; that is, 15% flat in the next five years. In fact, if I had researched SCGM more in-depth, I would possibly figure out how its net profit margin would be improved due to economy of scale. Since I did not, I rather take a conservative side.
EPM investment rate:
Firstly, I try to align it according to the management discussion in FY2016; RM 15m in FY2017, RM 16.5m in FY2018, and RM 16.5m in FY2019 (note: 33m/2 = 16.5m). By backward calculations, I find that the corresponding EPM investment rates are 49%, 41%, and 33.3% respectively. For the remaining FY2020 and FY2012, there is no guidance from the management. So, I’m a bit conservative and I assume just 25% each.
EPM depreciation rate:
According to SCGM’s Significant Accounting Policies, the principal annual deprecation rates used for EPM are 10% – 20%. My assumption is 18% flat in the next five years.
EPM assets turnover:
Economy of scale plays a role in EPM assets turnover. Again, I rather assume a conservative number – 6.0 in the next five years; because I do not have sufficient insight.
Dividend payout ratio:
I simply assume 65% in the next five years.
The table below shows my inputs and the simulation outputs. For simplicity, I remove the past nine year data and show only the future five year data.

Regarding to investment valuation, I create my investment case as follows.
Holding period:
SCGM management so far gives us their production expansion plan till 2019. So, I prefer my investment time frame to medium term three years.
PE multiple when selling shares:
As of today, the trailing PE multiple is around 26 to 27. Is it high? Here we need careful judgement. My gut feeling is to take 20.
Required rate of return:
I demand 16% average compounded rate of return in this investment case.
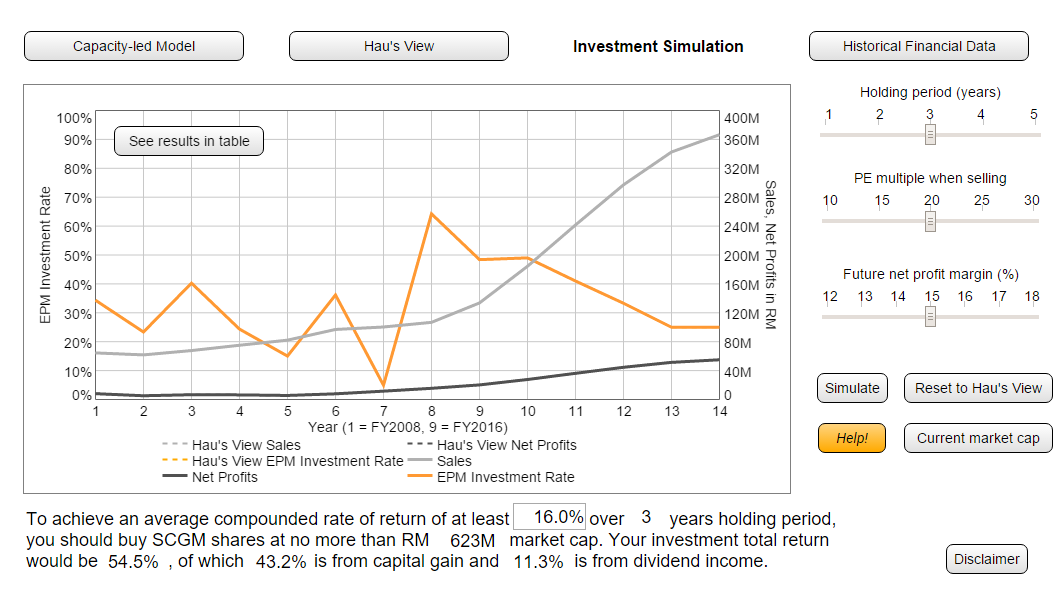
With all the inputs, I simulate my investment case and get the results in the screen shot below. The conclusion is that, if I require 16% rate of return over three years holding period, I should buy SCGM shares at around RM 623m. Currently market cap is around 620m, which means this is a right price to my investment case. My investment total return would be 54.5%, consisting of 43.2% capital gain and 11.3% dividend income.
How about margin of safety? We can find it out by setting required rate of return to be risk-free rate! However, which rate is appropriate? Should we simply use Malaysia government 10-year bond yield, currently standing at 4%? This could be a debate topic. Nevertheless, I simply apply 4% in this investment case. Then the calculated market cap is RM 857m. It means that the margin of safety in my investment case is around 27% (= 1 – 623m / 857m).

Simulate your own investment case
You can simulate your own “What if” scenario and create your own investment case. You may agree with me that the capacity-led growth model is useful to SCGM valuation; nevertheless, you may NOT agree on some other key assumptions like EPM investment rate and future net profit margin; or you may prefer to a five-year holding period and believe that you have high chance to sell your shares at PE multiple 25. Then take control of your own investment case by applying your preferred input settings and simulate your investment results! Here is the link to SCGM Investment Simulation. Have fun and good luck!
Try SCGM Investment Simulation here!
![]()
[1] SCGM has financial year ended on 30 April in every year
[2] EPM is equipment, plant and machinery. EPM (net) is stated at the end of the financial year whereas EPM assets turnover is calculated by dividing EPM (net) at the beginning of the financial year into sales. Although EPM assets could change within a financial year, this simple definition is sufficient to reveal the trend over few year time span
[3] EPM investment rate is calculated by dividing EPM (net) at the beginning of the financial year into EPM (addition) during the financial year
[4] Surely there is finite number of fishes in the ocean. The assumption here is that the number of fishes available to be caught far exceeds the capacity of the fishing boat
Disclaimer
This article is intended for research and educational purposes only. Materials in this article including, but not limited to, graphs, tables and screen shots featuring investment data is not recommendations to buy or sell. The investment analysis, information and related comments may be out-of-date when you read them. You should do your own research into any investment before making decision to buy or sell. This article is to assist you to perform your own investment analysis. Data provided in this article may be inaccurate or omitted and it is your responsibility to verify it in your analysis. We are not liable for your investment losses.
Related Stocks
| Chart | Stock Name | Last | Change | Volume |
|---|
More articles on Hau To Invest (Malaysia)
Discussions
1 person likes this. Showing 10 of 10 comments
Another one that justifies valuations because the model tells them so
1. Don’t create new terms like “EPM’ turnover just give credit where credit is due – aka Dupont’s ROE. Don’t complicate things to make it sound like you actually created something new. Everything that you can think of, has already been said
2. The next one is critical, and which you have completely missed, and it is so fundamental that it would jump right at you, were you actually able to get you head out of your model, hence why all the education and modelling does not help if you do not have the raw IQ, and that is:-
Plastic manufacturers have expanded margins and sales because RESIN prices have DROPPED over the last couple of years, mirroring the drop in crude oil to USD30/bbl
Prices however have been creeping up the last couple of Qtr’s (notwithstanding today’s oil price movement of course……..)
Edited for clarity
2017-06-05 22:26
@valuelurker, critical comments are useful! Below are my thoughs:
1) To actually simplify the model, I have to leave out other assets irrelevant to capacity-led growth model. So, only EPM assets are kept. I did not claim anything new for the empirical relationship between EPM assets and Sales
2) Indeed, if I think raw material price like resin is the limiting factor to SCGM future growth, then I could have built another model called cost-led growth
3) It is also possible I combine both capacity-led and cost-led to form a "hybrid" growth model. Then, it would be really more complicated
2017-06-05 23:17
Interesting and marvellous way ...
If could add the Effective Cost Range will be good to monitor and respond quickly.
2017-06-06 00:09
good effort but allow me to give some inputs
1.your overall assumptions are quite bullish as they are based on historical highs or close to it. eg net profit margin is 15%, I briefly played with the model, slight decrease in margin would reduce the valuation significantly
2. assuming that demand is all there to take is dangerous. demand may not grow as rapid as the capacity and never discount competition, especially in manufacturing.
3. looking at forecast sales and profit to 2019, compound growth is expected to be >30% a year. I am not too sure if the industry or SCGM is going to grow that rapidly and continuously over the next 3 years
4. for margin of safety, I would suggest instead of using MGS yield, try simulating how far the assumptions would need to change which would change your investment basis. if it's too sensitive, than your margin of safety may not be as high as you think
just my 2 cents
2017-06-06 08:14
Not a good analysis but great attempt. Please keep up with the good work. I will put your articles on my reading list
2017-06-06 08:48
@Jay,
1) Admittedly, I do not have much insight in profit margins because I didn't research it. As valuelurker already pointed out, oil price and, thus, raw material costs could explain gross profit margin improvement in the past two years; however, it could not explain those in in 2008 and 2009 when the oil price was significantly higher than today. Anyway, my opinion is that profit margins are NOT the limiting factors to SCGM growth but the production capacity. According to SCGM management guidance, EPM assets would be doubled in around next five years. As you also pointed out, 15% net profit margin is considered to be bullish; then how could we expect profit margins could be double in the next five years?
2) You're right. Two points from me. First, the production capacity expansion plan is taken from SCGM management. I just follow and "trust" them and, true, I could not judge whether they are bullish or not. Second, I did not explicitly assume that production capacity utilization is 100%; utilization is implicitly assumed in EPM assets turnover which I assumed to be 6.0, within historical range.
3) If all executions are according to SCGM's plan, it should be.
4) thanks for your suggestion
2017-06-07 05:53
Post a Comment
Featured Posts


Latest Videos


MQ Trading Signals
Time
Signal
Duration
Type
2025-01-10 10:20:00
ADX
10 Mins
BUY
2025-01-10 10:15:00
TURTLE SYSTEM 20
5 Mins
SELL
2025-01-10 10:15:00
TURTLE SYSTEM 55
5 Mins
SELL
2025-01-10 10:05:00
TURTLE SYSTEM 55
5 Mins
BUY
2025-01-10 10:00:00
TURTLE SYSTEM 20
30 Mins
BUY
Apps


Top Articles
1
THE INVESTMENT APPROACH OF CALVIN TAN
US 60% TARIFF ON CHINA: CHINA FDI INTO MALAYSIA & INDONESIA WILL BENEFIT THESE STOCKS, Calvin Tan
2
Initial Public Offering (IPO)
3
Kenanga Research & Investment
Technology - Export Restrictions and Tariff Threats (OVERWEIGHT)
4
Mercury Securities Research
5
Mercury Securities Research
6
RHB Investment Research Reports
7
Good Articles to Share
Tariff policy done well can help grow the economy, GOP senator says
8
PublicInvest Research
#
Stock
Score
Daily Stocks
Stock Name
Last
Change
Volume
Stock Name
Last
Change
Volume
Stock Name
Last
Change
Volume
Featured Advertisers / Partners


Ride The Bull Short The Bear
CS Tan
4.9 / 5.0
This book is the result of the author's many years of experience and observation throughout his 26 years in the stockbroking industry. It was written for general public to learn to invest based on facts and not on fantasies or hearsay....
RainT
Complicated
2017-06-05 20:14