


Hau To Invest (Malaysia)
SCGM: Capital Commitments

HauToInvest
Publish date: Mon, 26 Jun 2017, 05:04 AM
HauToInvest
0 8
This blog is for serious value investors. I select some relevant articles to post here. If you have interest to read my other articles, please visit www.hautoinvest.com
SCGM FY2017 Q4 results was announced on 22nd June. Could we improve SCGM sales growth estimate of FY2018 by examining its capital commitments revealed in it?
In my previous post (SCGM: “Sure Can” Growth Model), I proposed using EPM (Equipment, Plant and Machinery) investments to estimate future sales of SCGM Bhd (SCGM:KLS, stock code: 7247). But how do we know EPM investments in future? My method was to align it to the management discussion in FY2016. My estimates were seen as adding EPM in the table below (re-posted):
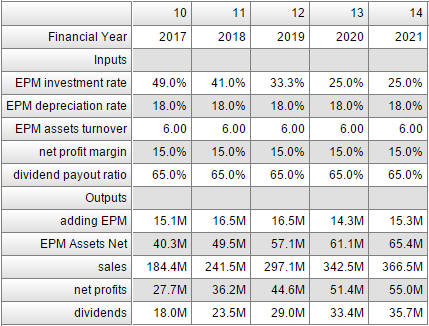

Sales were then calculated based on the following relationship:
EPM assets (net) * EPM assets turnover = Sales
where EPM assets (net, in RM) were measured at the beginning of financial year and EPM assets turnover was a multiple; both were independent inputs that determined sales as an output. In FY2017, sales were estimated to be RM 184.4m which is 3.1% higher than the un-audited RM 178.8m from SCGM FY2017 Q4 results announcement. Although 3.1% is a small difference, I could not yet judge whether my estimate is good or not; because EPM assets are missing in these quarterly results.
Improvement in quarterly results reporting
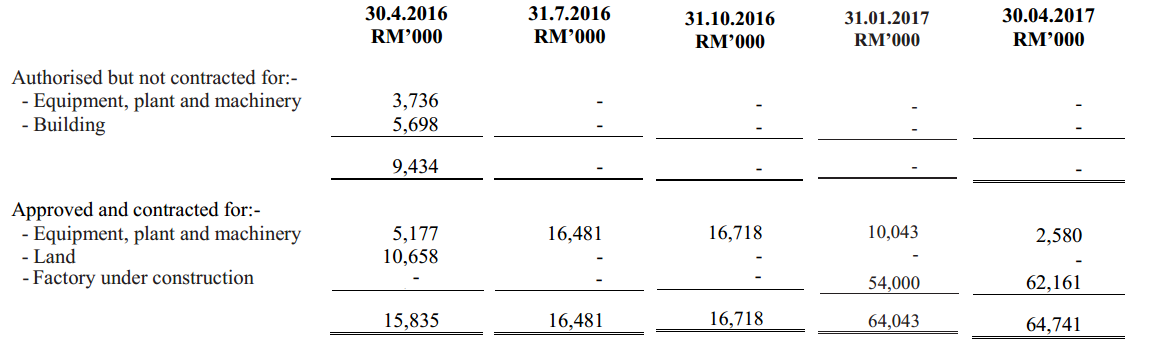
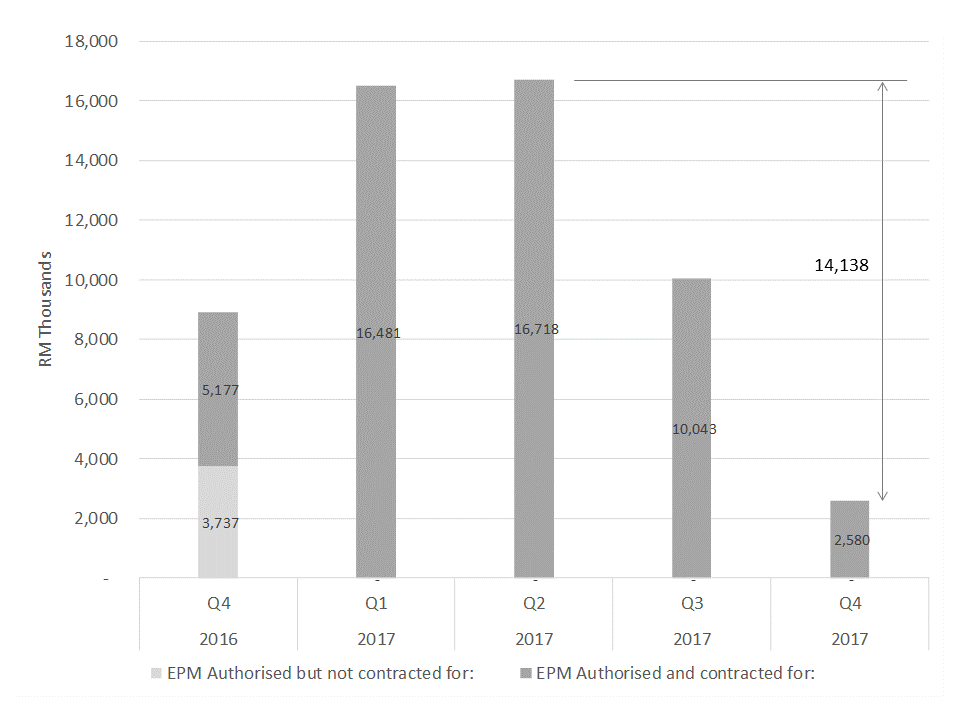
However, only recently I found an interesting thing – EPM appears under the notes A13 Capital Commitments in quarterly results since FY2017. I am happy to note that this is an improvement in quarterly[1] results reporting; prior to FY2017 only aggregate PPM (Property, Plant and Equipment) were reported. I screen-capture, combine and re-position these figures from FY2017 Q1 to Q4 results for easy comparison. Additionally, a chart is created for better data visualization.

Capital investment cycle
Before we attempt to get some insights from this chart, let’s briefly describe a capital investment cycle:
- Capital authorized by the board [1 day]
- Capital contracted for EPM [3 months]
- 1st installment of payment to supplier [1 day]
- EPM built and/or shipped to site [6 months]
- 2nd installment of payment to supplier [1 day]
- EPM installation and commissioning [1 month]
- Final installment of payment to supplier [1 day]
- EPM service life [5 to 10 years]
Manufacturing companies repeat this capital investment cycle in order to maintain, expand or contract its productive assets according to their plans. Though the sequence of the cycle is clear, the throughput time of some steps is uncertain. The time estimates in square brackets are from my gut feeling and are open for more accurate suggestions. It should be noted that in step 1 and 2, the capital is NOT yet registered in the financial statements. Rather, it appear in capital commitments in the notes. In step 3, part of the capital is registered as capital expenditure in the statement of cash flows and the remaining balance takes another six to seven months. After step 7, the book value of the EPM is fully recognised as assets in the balance sheet and will be depreciated over the next five to ten years. It would probably take another month or two to fully ramp up the productivity of the EPM.
Coming back to the question, could we improve SCGM sales growth estimate of FY2018 by examining its current capital commitments in its quarterly results?
My answer is yes, this could improve the sales growth estimates of the coming financial year, provided that step 2 takes longer than three months which quarterly reports can capture this off-balance sheet capital commitments. As the quarterly capital commitments is a snap-shot of the balance at a particular date, it does NOT reveal the capital inflow and outflow during a quarter. By comparing two consecutive quarters, we can only know the net capital inflow or outflow. In other words, if net change of the balance is zero, it does not necessarily mean that there is no capital inflow and outflow.
Hau’s view
For the specific case in SCGM 2017 quarterly results, there was RM 16.7m capital expenditure on EPM in the pipeline in Q2. As indicated in the chart, at least RM 14.1m was already registered in the financial statements by the end of Q4. Therefore, I believe at least RM 16.7m EPM will become new production capacity in the first half of FY2018. By chance, this RM 16.7m is in-line with my estimate of RM 16.5m (see adding EPM in FY2018 in the table) in my last post (SCGM: “Sure Can” Growth Model). In summary, this help us improve the quality of sales estimate in FY2018 and eventually SCGM valuation.
[1] Surely in annual report, the breakdowns of PPM (Property, Plant and Equipment) are also reported – namely 1) land, 2) buildings, and 3) equipment, plant and machinery. But for quarterly results, the first time was in FY2017.
Disclaimer
All articles in this blog are intended for research and educational purposes only. Materials in these articles including, but not limited to, graphs, tables and screen shots featuring investment data are not recommendations to buy or sell. The investment analysis, information, and related comments may be out-of-date when you read them. You should do your own due diligence into any investment before making the decision to buy or sell. While we aim to provide accurate data to assist you in performing your stock valuation, we do not take responsibility of any inaccurate or omitted data. Please verify them. We are not liable for your investment losses.
Related Stocks
| Chart | Stock Name | Last | Change | Volume |
|---|
More articles on Hau To Invest (Malaysia)
Discussions
Be the first to like this. Showing 6 of 6 comments
I am encouraged by the 2 for 15 free warrants.....not a 1 for 1 free warrants which floods the market. and too greedy.
2017-06-26 15:56
@stockmanmy, I suppose you read its Q4 management discussion about its operating margin. Do you mean you doubt it or you have another thought?
2017-06-26 16:27
I read the company announcement....I still don't understand how they cannot sell at higher prices if raw materials prices has increased.
But nevertheless, I remain a buyer, not a seller.
a company in rapid growth phases some times has to suffer lower margins due to increased fixed costs and depreciation and takes a few quarters for margins to normalise. ...so, I expect the company to report better margins in coming quarters.
2017-06-26 16:34
@stockmanmy, i share the same opinion. The depreciation charges and fix costs due to the new production facilities start on the first day of its service life, even though its capacity is far from fully utilized. It probably takes some quarters to achieve its normal level of margin.
2017-06-27 02:31
Post a Comment
Featured Posts
Introducing MY's First IPO Fund for Sophisticated Investors!
New Update. Discover investment communities that resonate with your ideas
M & A Value Partners IPO Equity Fund has been launched - Targeted 13% Return p.a
Latest Videos


MQ Trading Signals
Time
Signal
Duration
Type
2025-01-10 10:20:00
ADX
10 Mins
BUY
2025-01-10 10:15:00
TURTLE SYSTEM 20
5 Mins
SELL
2025-01-10 10:15:00
TURTLE SYSTEM 55
5 Mins
SELL
2025-01-10 10:05:00
TURTLE SYSTEM 55
5 Mins
BUY
2025-01-10 10:00:00
TURTLE SYSTEM 20
30 Mins
BUY
Apps


Top Articles
1
THE INVESTMENT APPROACH OF CALVIN TAN
US 60% TARIFF ON CHINA: CHINA FDI INTO MALAYSIA & INDONESIA WILL BENEFIT THESE STOCKS, Calvin Tan
2
Initial Public Offering (IPO)
3
Kenanga Research & Investment
Technology - Export Restrictions and Tariff Threats (OVERWEIGHT)
4
Mercury Securities Research
5
Mercury Securities Research
6
RHB Investment Research Reports
7
Good Articles to Share
Tariff policy done well can help grow the economy, GOP senator says
8
PublicInvest Research
#
Stock
Score
Daily Stocks
Stock Name
Last
Change
Volume
Stock Name
Last
Change
Volume
Stock Name
Last
Change
Volume
Featured Advertisers / Partners


Ride The Bull Short The Bear
CS Tan
4.9 / 5.0
This book is the result of the author's many years of experience and observation throughout his 26 years in the stockbroking industry. It was written for general public to learn to invest based on facts and not on fantasies or hearsay....
teoct
A good estimation of revenue growth. But of course there are many other factors that can make the estimated revenue higher or lower. "It is good to be roughly right than precisely wrong" John Maynard Keynes
2017-06-26 12:46