


Kenanga Research & Investment
Weekly Technical Highlights – FBM KLCI

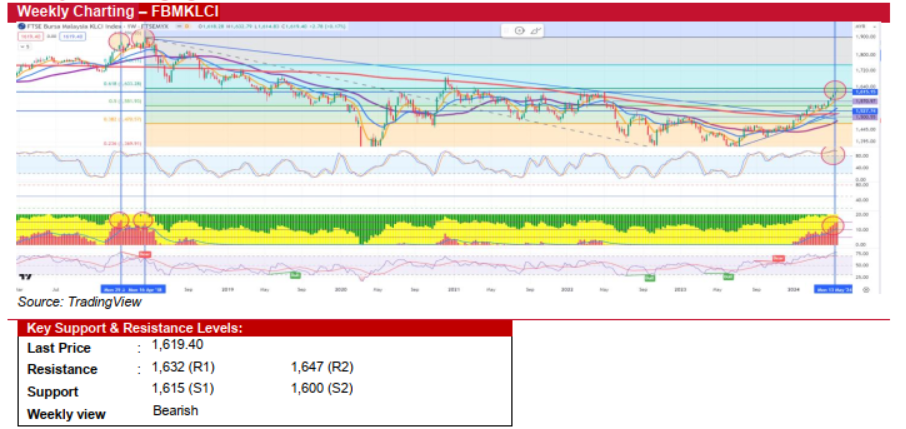
FBM KLCI (Bearish)
- Although the FBM KLCI maintained its upward momentum for most of last week, reaching a two-year high of 1,632 on Thursday, it dipped sharply on Friday due to renewed concerns over US interest rates and weak regional market performance. Despite this, it closed marginally higher by 0.17% at 1,619.40, led by strong performance in the Construction (+3.3%), Technology (+2.7%), and Energy (+1.6%) sectors. Daily traded volume and value remained robust, averaging over 6b units worth RM4b.
- Looking ahead, the local market direction will likely hinge on corporate earnings as we enter the peak of the final week of the reporting season. Additionally, the Semicon Southeast Asia 2024 conference on Tuesday, hosted by Miti, is expected to outline a comprehensive strategic plan for the local technology sector. Other key economic data to watch include Thursday’s updated US GDP estimate and Friday’s release of the core PCE index, the Fed's preferred measure of inflation, which could potentially move markets.
- Technically, the index has experienced a strong rally since January, achieving a YTD gain of 11.3% after breaking out from its 5-month consolidation zone formed since July 2023. However, this rally may be due for a review this week, as a shooting star candlestick pattern has appeared on its weekly charts, signaling a potential trend reversal. Additionally, as noted in our last review, the SmartMCDX, which measures buyer (banker) activity based on volume and price movement, has approached the 15 threshold, indicating that buyer activity may soon be exhausted. The weekly stochastic and RSI indicators remain in the overbought zone, further suggesting that a short-term correction is imminent.
- In summary, we expect long-overdue profit-taking to kick in this week, with immediate support levels at 1,615 and the psychological level at 1,600. The upward trend will remain intact as long as the index stays above the critical 5-week SMA level (around 1,584). Conversely, breaking above the recent high of 1,632 could propel the index to test the next resistance level at 1,647.
Source: Kenanga Research - 27 May 2024
More articles on Kenanga Research & Investment
Actionable Technical Highlights - PRESS METAL ALUMINIUM HLDG BHD (PMETAL)
Created by kiasutrader | Nov 25, 2024
Actionable Technical Highlights - PETRONAS CHEMICALS GROUP BHD (PCHEM)
Created by kiasutrader | Nov 25, 2024
Weekly Technical Highlights – Dow Jones Industrial Average (DJIA)
Created by kiasutrader | Nov 25, 2024
Malaysia Consumer Price Index - Edge up 1.9% in October amid food price surge
Created by kiasutrader | Nov 25, 2024
Discussions
Be the first to like this. Showing 0 of 0 comments
Post a Comment
Featured Posts


Latest Videos


Apps


Top Articles
1
2
3
Good Articles to Share
What’s behind the slew of restaurant bankruptcies in 2024? Experts unpack the problems
4
Good Articles to Share
5
Good Articles to Share
Four convicted in Spain over homophobic murder that sparked nationwode protests
6
Good Articles to Share
7
Good Articles to Share
#
Stock
Score
Daily Stocks
Stock Name
Last
Change
Volume
Stock Name
Last
Change
Volume
Stock Name
Last
Change
Volume
MQ Trading Signals
Stock
Time
Signal
Duration
Stock
Time
Signal
Duration
Featured Advertisers / Partners


Ride The Bull Short The Bear
CS Tan
4.9 / 5.0
This book is the result of the author's many years of experience and observation throughout his 26 years in the stockbroking industry. It was written for general public to learn to invest based on facts and not on fantasies or hearsay....