


Initial Public Offering (IPO)
IPO - Crest Group Bhd (Part 2)

MQTrader Jesse
Publish date: Wed, 25 Sep 2024, 12:50 PM
Financial Highlights
The summary of the combined statements of profit or loss and other comprehensive income for the Financial Periods Under Review is as follows:
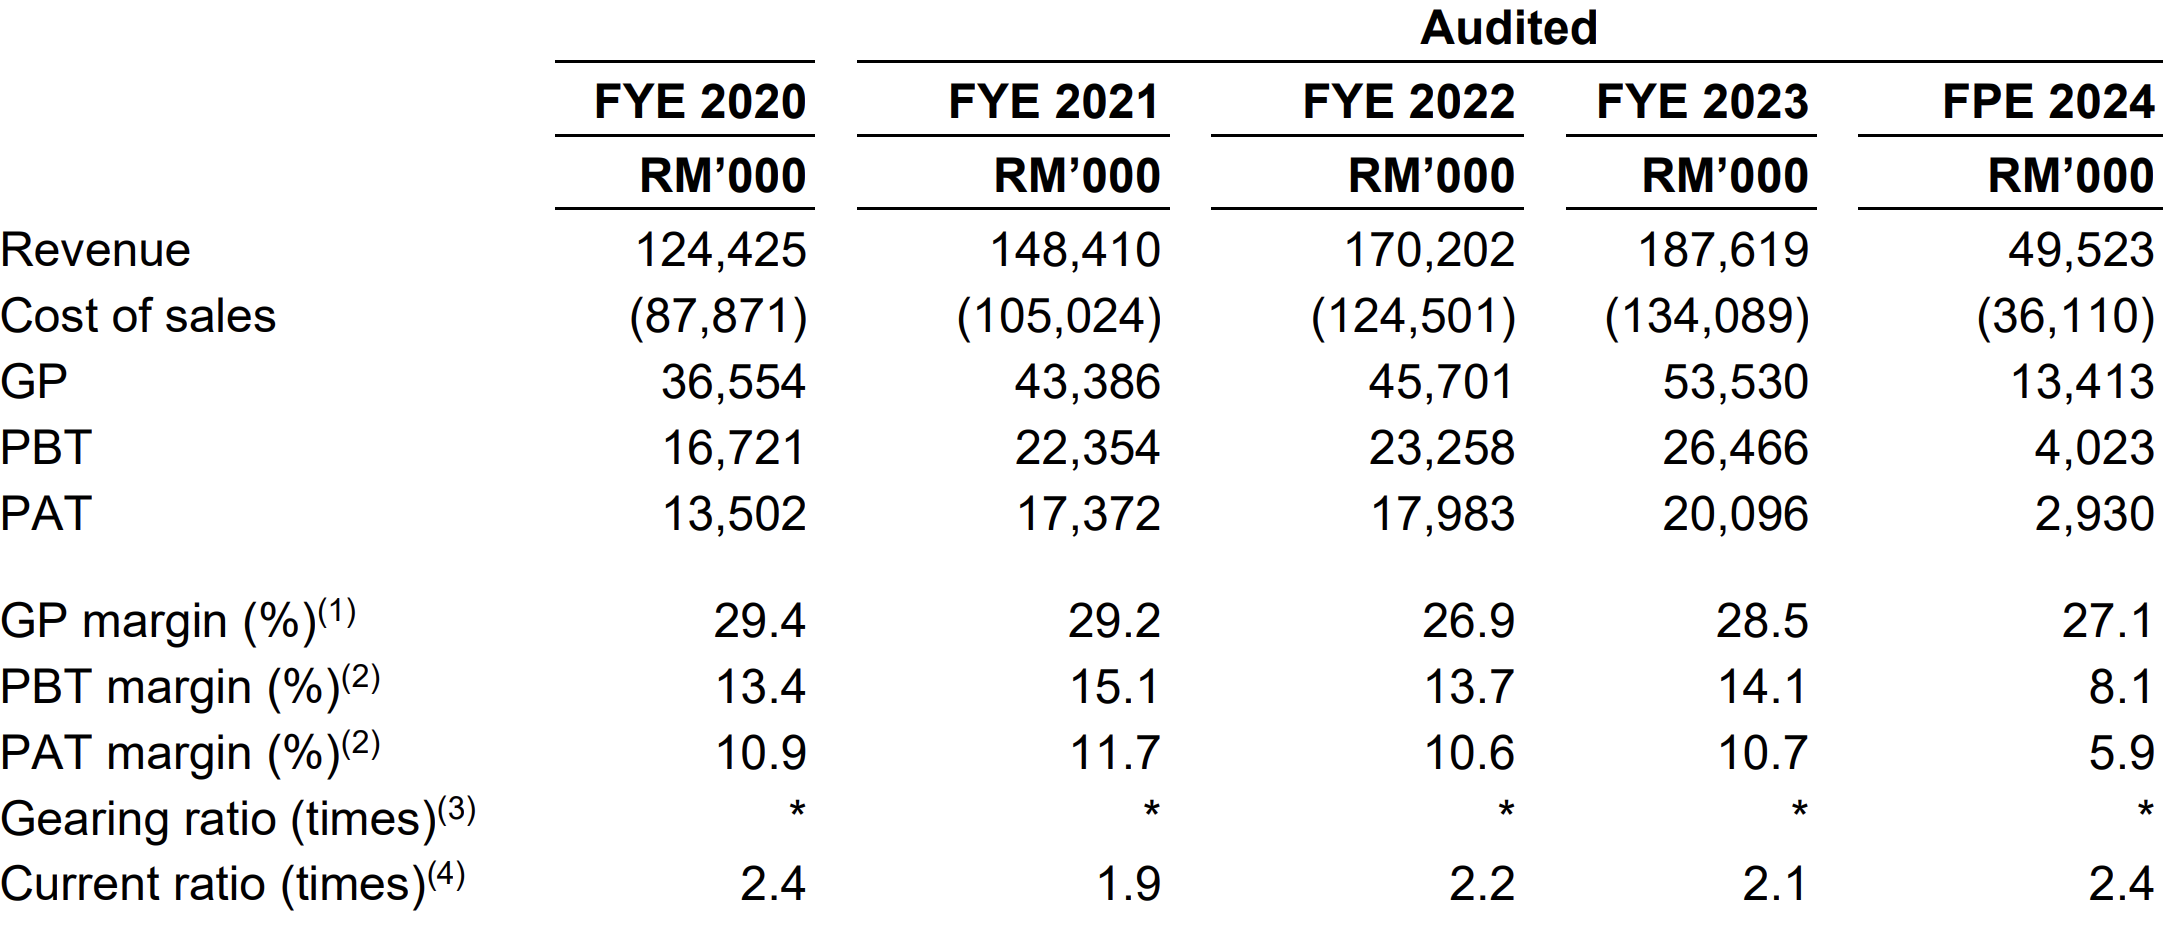
The revenue increased from RM 124 million in FYE 2020 to RM 187 million in FYE 2023. The decrease in revenue is mainly contributed by the higher revenue recorded for the provision of imaging, analytical and test solutions segment during FYE 2023.
The GP margin dropped from 29.4% in the FYE 2020 to 26.9% in the FYE 2022 but increased to 28.5% in FYE 2023. The recovery in GP margin was primarily contributed by the higher GP margin from the sales of X-ray fluorescence analyser and remote visual inspection equipment.
The PAT margin fluctuates between 10.6% to 11.7% from FYE 2021 to FYE 2023.
The gearing ratio is less than 0.1 in FYE2023, which is below the benchmark. This indicates that the company still has room to increase its debt further, indirectly suggesting that in the event of any crisis, the company will not easily face risks due to excessive debt. (A good gearing ratio should be between 0.25 – 0.5).
Major customers and suppliers
In the Financial Years Under Review and FPE 2024, total revenue contributed by the top 5 major customers accounted 16.22%, 15.31%, 25.34%, 18.70% and 25.94% of the Group’s total revenue respectively. The top 5 major customers in the Financial Years Under Review and FPE 2024 were mainly from semiconductor industry. The revenue were mainly generated on ad-hoc / per order basis for imaging, analytical and test solutions and on recurring basis for technical support and maintenance services.
The Group is not dependent on any of the major customers as the revenue contribution from each of the major customers is less than 10.00% of the total revenue for the respective FYE and FPE, with the exception of one customer (i.e. Customer Group E), who contributed 10.26% of the total revenue for FYE 2022. However, Customer Group E’s contribution to the total revenue of the Group were less than 10.00% for FYE 2020, FYE 2023 and FPE 2024, i.e. 2.11%, 5.39% and 9.61% respectively, and in FYE 2021, Customer Group E is not a top 5 customer. Hence, the group is not dependent on any of the major customers.
Major Suppliers
All purchases of equipment from the suppliers (i.e. principals and dealers) are based on purchase order basis. The Group is dependent on the major suppliers, namely Supplier Group A and Supplier Group B in the Financial Years Under Review and FPE 2024 for the purchase of equipment.
Industry Overview
The imaging, analysis and testing industry refers to a sector providing equipment and services for the imaging, inspection, analysis, testing and measurement of various parameters and characteristics of materials, components and samples for different applications, catering towards companies, institutions and/or organisations from various fields and industries for their manufacturing operations, quality control processes and/or research and development (“R&D”) activities, amongst others. The imaging, analysis and testing industry serves a wide range of fields and industries including electrical and electronics (“E&E”), semiconductor, automotive, aerospace, healthcare, life science, material science, oil and gas, and research (e.g. academic and clinical).
The imaging, analysis and testing industry can be broadly segmented into equipment and services, as follows:

Imaging, analytical and test solution providers in Malaysia may offer both equipment and services as a solution to customers. As these solution providers do not develop and manufacture equipment, they typically collaborate with product principals to distribute the product principals’ equipment.
Key demand drivers
The demand for imaging, analytical and test equipment and services is driven by the growth of various industries that utilise such equipment and services.
Government support and initiatives will spur the growth of the imaging, analysis and testing industry in Malaysia.
Rising adoption of IoT and Industry 4.0 technologies drives demand for imaging, analytical and test equipment and services.
Market share
In 2023, the imaging, analysis and testing industry size in Malaysia was recorded at RM7,251 million. For the financial year end 31 December 2023, Crest Group’s revenue derived from Malaysia was recorded at RM70.54 million, and thereby Crest Group captured a market share of 0.97% in the imaging, analysis and testing industry in Malaysia.
Future plans and strategies for CREST GROUP BERHAD
The Group’s future plans and strategies are summarised as below:
They intend to set up a new headquarters (“New HQ”) in Selangor to consolidate their operations in the Central region of Malaysia.
They intend to purchase additional demonstration equipment for the demonstration room in Malaysia, PRC and Thailand offices.
They plan to expand their business presence to Vietnam, PRC and Thailand.
MQ Trader View
Opportunities
The group’s industry knowledge as well as technical expertise enable us to propose suitable solutions for the customers.
The group has business presence in 4 countries and a diversified customer base spanning across multiple industries and countries.
Risk
The group depends on the ability to maintain their business relationship with the existing customers and to secure new customers.
The group is exposed to fluctuations in foreign exchange rates.
The group is subject to operational risks and the risk of inadequate insurance compensation.
Click here to continue the IPO - Crest Group Bhd (Part 1)
Eager to explore more trading opportunities? Apply margin account now!
https://bit.ly/mqatamargin
Community Feedback
We encourage traders to try out and evaluate the MQ Trader system and provide us feedback on the features you like to see in the system. We have received many positive feedbacks so far, and we are currently compiling and reviewing them for possible inclusion into the next release of the system.
We would like to develop this system based on community feedback to cater for community needs. Thanks to all those who have provided valuable feedback to us. Keep those feedback coming in!
Disclaimer
This article does not represent a BUY or SELL recommendation on the stock covered. Traders and Investors are encouraged to do their own analysis on stocks instead of blindly following any Trading calls raised by various parties in the Internet. We may or may not hold position in the stock covered, or initiate new position in the stock within the next 7 days.
Join us now!
MQ Trader stock analysis system uses Artificial Intelligence (AI), various technical indicators and quantitative data to generate accurate trading signals without the interference of human's emotions and bias against any particular stock. It comprises trading strategies which are very popular among fund managers for analysing stocks.
MQ Trader stock analysis system is SPONSORED for MQ Trader members. To use this amazing tool, you can sign up via MQ Trader Sign Up!
Contact us
Please do not hesitate to contact us if you have any enquiry:
Facebook: https://www.facebook.com/mqtrader
Instagram:https://www.instagram.com/mqtrader
MQ Chat: https://messenger.i3investor.com/m/chatmq
YouTube: https://www.youtube.com/channel/UCq-26SGjlQTVQfO7DoEihlg
Related Stocks
| Chart | Stock Name | Last | Change | Volume |
|---|
Market Buzz
More articles on Initial Public Offering (IPO)


Discussions
Be the first to like this. Showing 0 of 0 comments
Post a Comment
Featured Posts
Introducing MY's First IPO Fund for Sophisticated Investors!
New Update. Discover investment communities that resonate with your ideas
M & A Value Partners IPO Equity Fund has been launched - Targeted 13% Return p.a
Latest Videos


Apps


Top Articles
1
Dragon Leong blog
2
Stock Market Enthusiast
Feng Shui Market Outlook for FBM KLCI in the Year of the Wood Snake (2025)
3
The Alpha Trader
4
Rakuten Trade Research Reports
5
TA Sector Research
6
Stock Market Enthusiast
3 Resilient Stocks That Defied Malaysia’s Market Slump in January 2025 - #GCB, #ABMB, #CDB
8
MQ Market Updates
#
Stock
Score
Daily Stocks
Stock Name
Last
Change
Volume
Stock Name
Last
Change
Volume
Stock Name
Last
Change
Volume
Featured Advertisers / Partners


Ride The Bull Short The Bear
CS Tan
4.9 / 5.0
This book is the result of the author's many years of experience and observation throughout his 26 years in the stockbroking industry. It was written for general public to learn to invest based on facts and not on fantasies or hearsay....