


MQTrader Education Series
MQ Trader – Indicators of Volume Screener

MQTrader Jesse
Publish date: Wed, 08 Aug 2018, 06:46 PM
Introduction
This article is mainly focusing on MQ Trader Volume Screener which is continuing the last topic that we posted. For understanding more on this topic, kindly read MQ Trader – How to pick a stock?
What is Volume in Stocks?
Volume is the total amount of contracts that are traded successfully within a given period of time. Each transaction contributes to one trading volume where one successful transaction is made when buyers agree to sell the shares to sellers at a certain price. Thus, the trading volume will be high when there are a lot of buyers and sellers trading the stocks at a particular price.
How does Volume affect stock price?
Volume plays a vital role in confirming the strength of the current trend and measuring probability of a trend reversal. The higher the volume when the share price changes, the greater the movement of the share price. Volume tends to affect share price a lot because a stock price is determined by the supply and demand in the market. The share price will increase tremendously when many traders are interested to own the shares and vice versa.
What is MQ Trader Volume Screener?
Volume screener is very useful for detecting high volume in a stock trading that may indicate a reversal of a trend from sideways or downtrend to uptrend. MQ Trader Volume Screener is launched to fit the requirement Malaysia’s traders in identifying the market liquidity, price volatility and trading momentum efficiently.
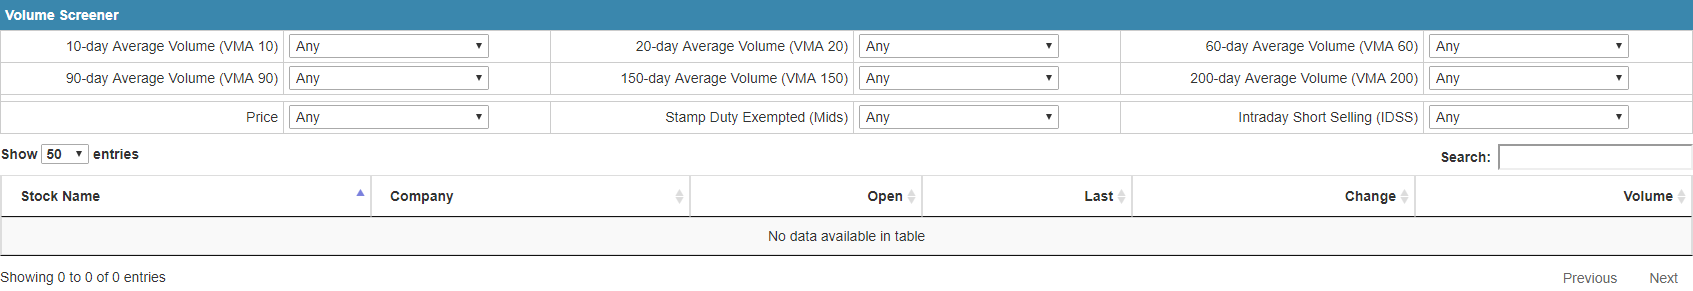
Source: MQ Trader Stock Analysis System
Volume Indicators
There are a few volume indicators included in MQ Trader Volume Screener:
- Volume Moving Average (VMA)
- VMA 10
- VMA 20
- VMA 60
- VMA 90
- VMA 150
- VMA 200
- Price – to filter out pennies stocks
- Stamp Duty Exempted (mids)
- Intraday Short Selling (IDSS)
What is Volume Moving Average (VMA)?
The core indicator that is used in MQ Trader Volume Screener is Volume Moving Average (VMA) which is similar to simple moving average. VMA is the average amount of individual securities traded over a specified amount of time. It has a smoothing effect on short-term volume spikes, so VMA with longer period will tend to smooth out volume spikes more effectively. Thus, Longer-term VMAs tend to detect the trend reversal slower than shorter-term VMAs.
Calculation of VMA:
VMA = (Sum of N volume bars) / N
Multiple VMAs (2 or more VMAs) can be used to compare their trends with each other to recognize the period when the trading volume of a stock is below or above its longer term average volume. This technique allows us to detect abnormal trading activity due to panic selling or greedy buying which are the main factors to contribute to downtrends or uptrends respectively.
Conclusion
Volume of a stock should be taken into consideration for making decision in our investment, as it represents the level of interest of traders in a security. Besides, volume is also able to confirm the price trends, breakouts and potential reversals which can enhance the technical analysis of a stock by using volume screener. To learn more about MQ Trader Volume Screener, you can read MQ Trader – Volume Screener.
Community Feedback
We encourage traders to try out and evaluate the MQ Trader system and provide us feedback on the features you like to see in the system. We have received many positive feedbacks so far, and we are currently compiling and reviewing them for possible inclusion into the next release of the system.
We would like to develop this system based on community feedback to cater for community needs. Thanks to all those who have provided valuable feedback to us. Keep those feedbacks coming in!
Disclaimer
This article does not represent a BUY or SELL recommendation on the stock covered. Traders and Investors are encouraged to do their own analysis on stocks instead of blindly following any Trading calls raised by various parties in the Internet. We may or may not hold position in the stock covered, or initiate new position in the stock within the next 7 days.
Join us now!
MQ Trader stock analysis system uses Artificial Intelligence (AI), various technical indicators and quantitative data to generate accurate trading signals without the interference of human's emotions and bias against any particular stock. It comprises trading strategies which are very popular among fund managers for analysing stocks.
MQ Trader stock analysis system is SPONSORED for MQ Trader members. To use this amazing tool, you can sign up via MQ Trader Sign Up!
Contact us
Please do not hesitate to contact us if you have any enquiry:
Email: service@mqtrader.com
More articles on MQTrader Education Series

Is there a safe haven to invest in a recessionary environment?
Created by MQTrader Jesse | Apr 13, 2023
MQ Trader - Why trade in a stock market that has strong currency?
Created by MQTrader Jesse | Aug 06, 2021
MQ Trader - How to validate buy signals by using MQ Live Backtesting? [ECOWLD]
Created by MQTrader Jesse | Nov 01, 2019
Featured Posts
New Update. Discover investment communities that resonate with your ideas

Apps


Top Articles
1
https://dividendguy67.blogspot.com
2
3
4
6
Good Articles to Share
7
Good Articles to Share
Sydney house fire kills three children, police suspect homicide
8
Good Articles to Share
#
Stock
Score
Daily Stocks
Stock Name
Last
Change
Volume
Stock Name
Last
Change
Volume
Stock Name
Last
Change
Volume
MQ Trading Signals
Stock
Time
Signal
Duration
No trading signals available.
Stock
Time
Signal
Duration
No trading signals available.
Featured Advertisers / Partners


Ride The Bull Short The Bear
CS Tan
4.9 / 5.0
This book is the result of the author's many years of experience and observation throughout his 26 years in the stockbroking industry. It was written for general public to learn to invest based on facts and not on fantasies or hearsay....