Trading Stocks - YTL Power International
rhbinvest
Publish date: Tue, 06 Dec 2022, 09:16 AM

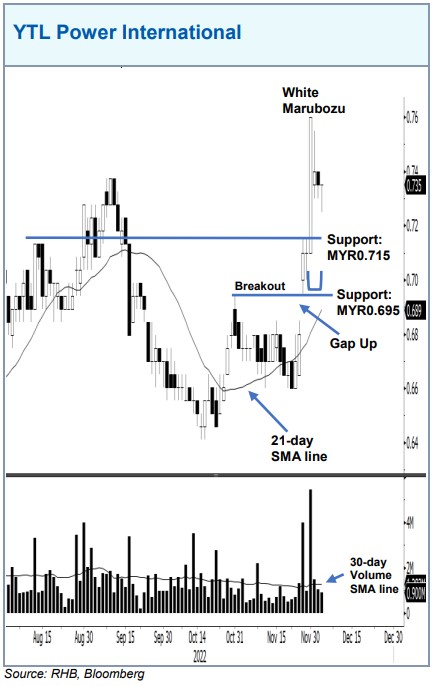
YTL Power International is set to trend north towards its YTD high, as it breached the MYR0.715 immediate resistance last Wednesday and printed a bullish “Marubozu” candlestick, then retraced mildly with lower volume until yesterday. Coupled with the “higher high” bullish pattern being above the 21-day SMA line, we think the bulls may re-emerge above that level to push the stock closer to its YTD high of MYR0.79, followed by the MYR0.85 mark. Conversely, the stock may reverse direction if it falls below the MYR0.695 support, forming a “lower low” bearish structure beneath the average line.
Source: RHB Securities Research - 6 Dec 2022
Related Stocks
| Chart | Stock Name | Last | Change | Volume |
|---|
Market Buzz
2025-01-21
YTLPOWR2025-01-21
YTLPOWR2025-01-20
YTLPOWR2025-01-20
YTLPOWR2025-01-20
YTLPOWR2025-01-20
YTLPOWR2025-01-20
YTLPOWR2025-01-17
YTLPOWR2025-01-17
YTLPOWR2025-01-17
YTLPOWR2025-01-17
YTLPOWR2025-01-17
YTLPOWR2025-01-17
YTLPOWR2025-01-16
YTLPOWR2025-01-16
YTLPOWR2025-01-15
YTLPOWR2025-01-15
YTLPOWR2025-01-15
YTLPOWR2025-01-15
YTLPOWR2025-01-14
YTLPOWR2025-01-14
YTLPOWR2025-01-14
YTLPOWR2025-01-14
YTLPOWR2025-01-14
YTLPOWR2025-01-14
YTLPOWR2025-01-13
YTLPOWR2025-01-13
YTLPOWRMore articles on RHB Investment Research Reports
Created by rhbinvest | Jan 21, 2025


