E-mini Dow Futures - Bullish Mode Intact
rhboskres
Publish date: Mon, 22 Apr 2019, 08:41 AM

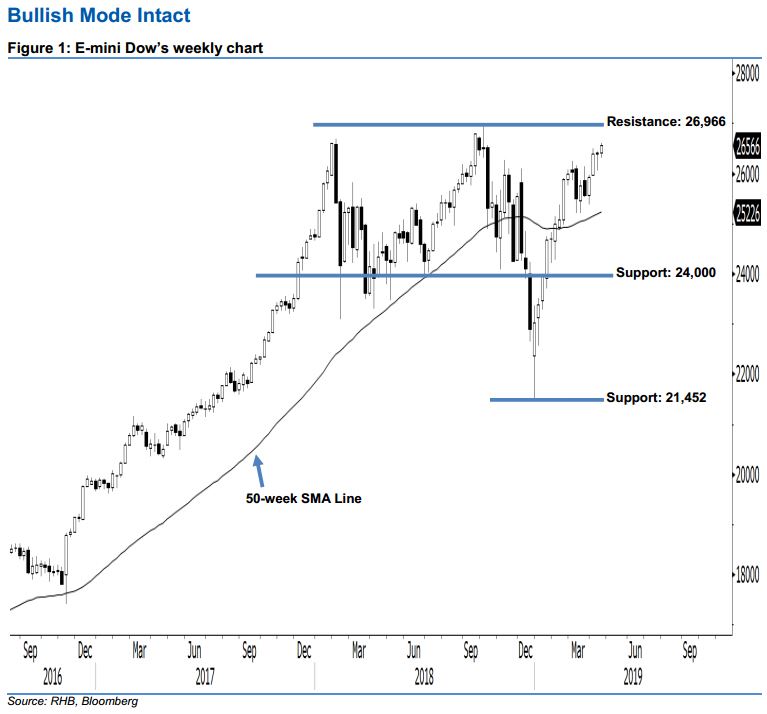
Longer-term bullish trend stays intact. Today, we analyse the E-mini Dow’s longer-term trend based on its weekly chart. Last week, the index ended higher to form a white candle, indicating persistent upward momentum. From a technical viewpoint, the index has marked a higher close vis-à-vis the previous few weeks since lateMarch, implying a bullish sentiment outlook. Furthermore, the index is now trading above the rising 50-week SMA line, suggesting that the bulls could be extending the upward momentum in coming sessions. Overall, we think that the market rebound, which started from 26 Dec 2018’s low, may continue.
Judging from the weekly chart, the immediate support is seen at the 24,000-pt round figure. The crucial support is seen at 21,452 pts, obtained from the lowest point in 2018. On the other hand, we are eyeing the immediate resistance at the 26,966-pt historical high. If a decisive breakout occurs, the next resistance is anticipated at the 28,000-pt psychological mark.
Hence, we advise traders to stick to long positions. This is because signs of a significant reversal have not emerged yet. Kindly refer to our 19 Apr 2019 report for more details.
Source: RHB Securities Research - 22 Apr 2019
More articles on RHB Retail Research
Created by rhboskres | Aug 26, 2024


