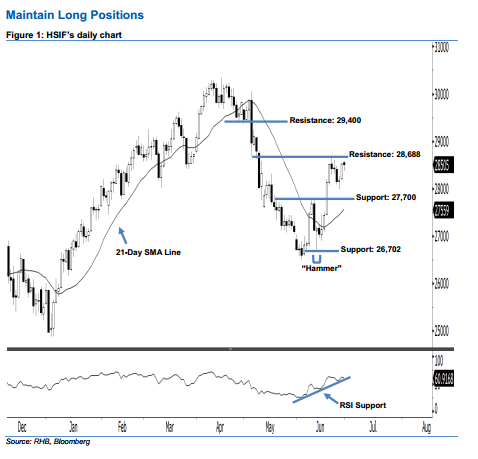
Hang Seng Index Futures - Maintain Long Positions
rhboskres
Publish date: Tue, 02 Jul 2019, 10:18 AM

Stay long. The HSIF formed a black candle with a long lower shadow last Friday. It dropped to a low of 28,367 pts during the intraday session, before ending at 28,505 pts for the day. Still, it is not surprising that buyers may be taking a breather following the recent gains. Technically speaking, last Friday’s long lower shadow implied that there was initial selling pressure during the day before the market moved up by the end of the trading session. This indicates that the market outlook was still bullish.
As seen in the chart, we are eyeing the immediate support at 27,700 pts, which is situated near the midpoint of 19 Jun’s long white candle. The next support is seen at 26,702 pts, ie the low of 13 Jun’s “Hammer” pattern. To the upside, we maintain the immediate resistance at 28,688 pts, which was the high of 21 Jun. If a decisive breakout occurs, look to 29,400 pts – set near the midpoint of 6 May’s long black candle – as the next resistance.
Hence, we advise traders to maintain long positions, given that we initially recommended initiating long above the 27,436-pt level on 12 Jun. At the same time, a trailing-stop can be set below the 27,700-pt threshold to lock in part of the gains.
Source: RHB Securities Research - 2 Jul 2019
More articles on RHB Retail Research
Created by rhboskres | Aug 26, 2024


