Hang Seng Index Futures: Rebound Stays Intact
rhboskres
Publish date: Mon, 21 Oct 2019, 09:28 AM

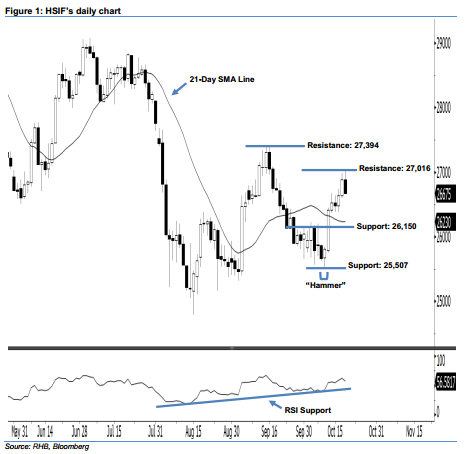
Maintain long positions. After posting two white candles in a row, the HSIF ended lower to form a black candle last Friday. It closed at 26,675 pts, after oscillating between a high of 27,016 pts and low of 26,657 pts. However, on a technical basis, last Friday’s black candle can be viewed as a pullback after the recent gains. We think the positive sentiment has not diminished thus far, given that the index is still trading above the 21-day SMA line and the 25,507-pt support mentioned previously. Overall, we remain positive on the HSIF’s outlook.
According to the daily chart, the immediate support level is seen at 26,150 pts, set near the midpoint of 11 Oct’s long white candle. The next support is maintained at 25,507 pts, which was the low of 10 Oct’s “Hammer” pattern. To the upside, we are eyeing the immediate resistance level at 27,016 pts, determined from the high of 18 Oct. Meanwhile, the next resistance is maintained at 27,394 pts, ie 16 Sep’s high.
Therefore, we advise traders to stay long, since we initially recommended initiating long above the 26,150-pt level on 16 Oct. A stop loss can be set below the 25,507-pt level in order to limit the downside risk
Source: RHB Securities Research - 21 Oct 2019
More articles on RHB Retail Research
Created by rhboskres | Aug 26, 2024


