Hang Seng Index Futures: Taking a Breather
rhboskres
Publish date: Tue, 22 Oct 2019, 09:49 AM

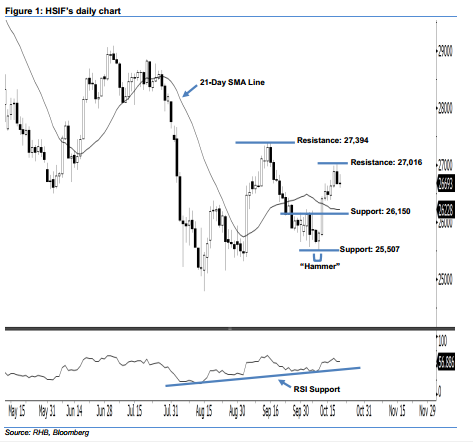
Stay long, with a stop-loss set below the 25,507-pt support. The HSIF formed a “Doji” candle yesterday. It settled at 26,693 pts, after hovering between a high of 26,843 pts and low of 26,604 pts. Still, the bullish sentiment stays unchanged as this candle can only be viewed as buyers probably taking a breather after the recent gains. Since the index is still holding above the 21-day SMA line, this indicates that the upside move is not over yet. Overall, we believe the upside swing that started off 10 Oct’s “Hammer” pattern would likely persist in the coming sessions.
As seen in the chart, we anticipate the immediate support level at 26,150 pts, ie near the midpoint of 11 Oct’s long white candle. Meanwhile, the next support will likely be at 25,507 pts, defined from the low of 10 Oct’s “Hammer” pattern. Towards the upside, the immediate resistance level is maintained at 27,016 pts, ie 18 Oct’s high. If a breakout arises, the next resistance is seen at 27,394 pts, which was 16 Sep’s high.
Hence, we advise traders to stay long, in line with our initial recommendation to have long positions above the 26,150-pt level on 16 Oct. A stop-loss is advisable to set below the 25,507-pt mark in order to minimise the downside risk.
Source: RHB Securities Research - 22 Oct 2019
More articles on RHB Retail Research
Created by rhboskres | Aug 26, 2024


