


RHB Retail Research
E-mini Dow Futures - Surging to a Historical High

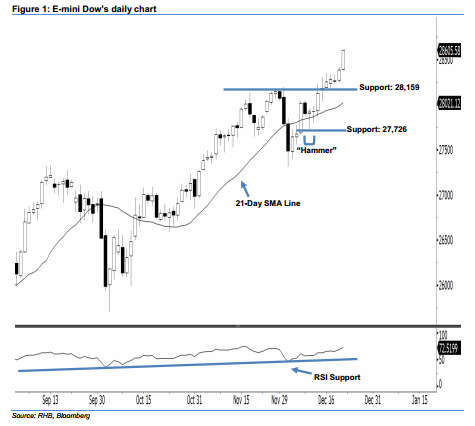
The bullish trend is likely to persist, stay long. The E-mini Dow’s upside move has continued as expected, as a second consecutive white candle was formed last Friday. It settled at 28,605.58 pts, off the session’s low of 28,373 pts. Based on the current technical landscape, last Friday’s close has taken out the 28,500-pt resistance mentioned previously – it also sent the index to its historical high. This indicates that the buying momentum has extended. Overall, we think the rebound that began from 10 Dec’s “Hammer” pattern may continue.
As seen in the chart, we are eyeing the immediate support level at 28,159 pts, which is set at the low of 16 Dec. If a breakdown arises, the crucial support is seen at 27,726 pts, or the low of 10 Dec’s “Hammer” pattern. To the upside, the near-term resistance level is now anticipated at the 29,000-pt psychological mark. This is followed by the 29,500-pt round figure.
Therefore, we advise traders to maintain long positions, in line with our initial recommendation to have long positions above the 28,159-pt level on 17 Dec. In the meantime, a stop-loss can be set below the 27,726-pt mark to limit the downside risk.
Source: RHB Securities Research - 23 Dec 2019
More articles on RHB Retail Research
Discussions
Be the first to like this. Showing 0 of 0 comments
Post a Comment
Featured Posts


Latest Videos


Apps


Top Articles
1
CEO Morning Brief
PGF Capital to Distribute Thermal Insulated Panels for Data Centres
3
Rakuten Trade Research Reports
4
5
The Alpha Trader
6
Bimb Research Highlights
7
Chloe Tai Blog
8
RHB Investment Research Reports
#
Stock
Score
Daily Stocks
Stock Name
Last
Change
Volume
Stock Name
Last
Change
Volume
Stock Name
Last
Change
Volume
MQ Trading Signals
Stock
Time
Signal
Duration
Stock
Time
Signal
Duration
Featured Advertisers / Partners


Ride The Bull Short The Bear
CS Tan
4.9 / 5.0
This book is the result of the author's many years of experience and observation throughout his 26 years in the stockbroking industry. It was written for general public to learn to invest based on facts and not on fantasies or hearsay....