RHB Retail Research
Trading Stocks - Kelington Group
rhboskres
Publish date: Wed, 17 Nov 2021, 04:48 PM

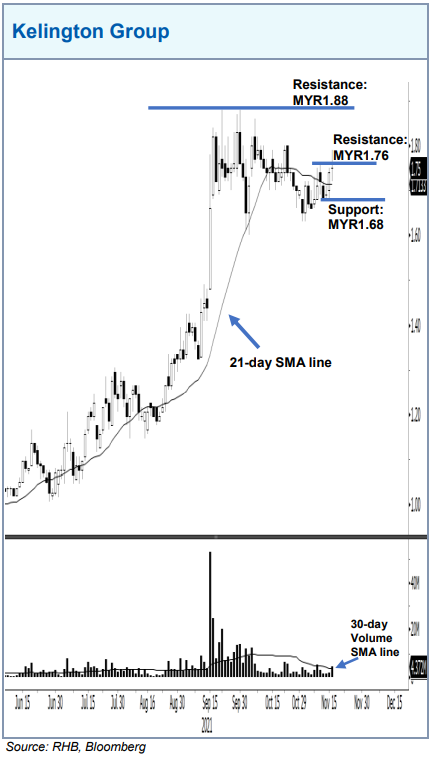
Kelington Group may reclaim its historical high, as it bounced off the 21-day average line, while climbing towards the immediate resistance MYR1.76 on high trading volume. If it manages to breach that level, it may hit the historical high – at the MYR1.88 threshold, before moving towards the uncharted territory marked by the MYR2.00 threshold. However, falling below the MYR1.68 support may see the stock descending further.
Source: RHB Securities Research - 17 Nov 2021
Related Stocks
| Chart | Stock Name | Last | Change | Volume |
|---|
More articles on RHB Retail Research
Duopharma Biotech - Lacking Near-Term Re-Rating Catalysts; D/G NEUTRAL
Created by rhboskres | Aug 26, 2024
Discussions
Be the first to like this. Showing 0 of 0 comments


