


Round & Surge Operator Analysis
Understanding & Application Of The Indicators Type

roundnsurge
Publish date: Sat, 20 Nov 2021, 04:27 PM
roundnsurge
0 59
"True trader react to the market" is the core of our Operator analysis. Operator Analysis analyze the price and volume of the big boys in equity market, where we currently using our analysis in gold market, Bitcoin and Malaysia market.
We will be sharing education material here such as to become a successful trader & investor, corporate action explanation, the financial instrument in the market you can utilize for your investment and more. We are here to help you understand the stock market.
We will be sharing education material here such as to become a successful trader & investor, corporate action explanation, the financial instrument in the market you can utilize for your investment and more. We are here to help you understand the stock market.

Indicators is a calculation to help analysts or traders to analyze the possible market trend or upcoming price movements by smoothening the price movement of an underlying asset based on price data, volume, or a combination of both.
It is very common that indicators often lag and are not reliable for entry & exit decision making. This is due to the price & volume data used to construct the indicators based on x no. of HISTORICAL data. The big boys' expectations can’t be shown with historical data, because the price mark up or a rebound from MA line, might not be indicating the big boys are supported or the average price bought by them.
Our principle of trading in the stock market is based on the big boys' intention, we understand that big boys sell on the way up & retail investors buy on the way down. This is how the big boys make profit, while having enough buyers to absorb their huge holdings when the price is on the way up and not creating panic in the market by flooding their shares out into the market. That is the reason why we don’t use indicators in our trading because it doesn’t tell us the intention of the big boys.
However, not many traders & investors understand how the big boys work in the stock market by analyzing the price & volume transaction data. That’s why they have no other choice but to rely on these indicators or traditional technical analysis.
If you want to understand more about the big boys' operation you may follow the link below:
Don’t get us wrong, we are not saying indicators don’t work, it is just not that efficient and direct compared to analyzing the price & volume movements. It still works well to some extent if you use the right indicators at the right timing/ trend. But do expect some lag in exit and entry signals as we’ve said earlier.
Understanding types of indicators
A common mistake done by many traders & investors is applying “more is better”. Having all the indicators that they have learned or heard from others added into the chart, like the example below:
Having too many indicators not just delays your decision making but also confuses you with it. We have to understand the nature of the indicator is lag, if you are relying on too many indicators, you are making it more “laggy”. Probably this is one of the reasons why many retail investors always enter at a high price.
Indicators are categorized into Trend, Mean Reversion, Relative Strength Indicator, Momentum Indicator, & Volume Indicator. Within these indicators, it is subdivided into leading & lagging indicators. Some might have categorized the above differently.
Leading indicators: try to predict the price movement based on the historical data.
Lagging indicators: shows the current price consequence from historical data.
It is important to understand what kind of indicators you are using for your investment. If you want to find what is the current trend, you should look at lagging indicators. Apply leading indicators if you are predicting the future price movement. A reminder again, these indicators are just to help investors to measure the possible outcome of the price, you should only serve these indicators as a reference. Because it doesn’t really represent the “big boys” expectation.
Many investors & traders didn’t understand the difference between leading & lagging indicators. That’s why many of them are using lagging indicators to time their investment entry (such as MA & Bollinger Band), which is not an indicator to decide the entry or exit.

Application
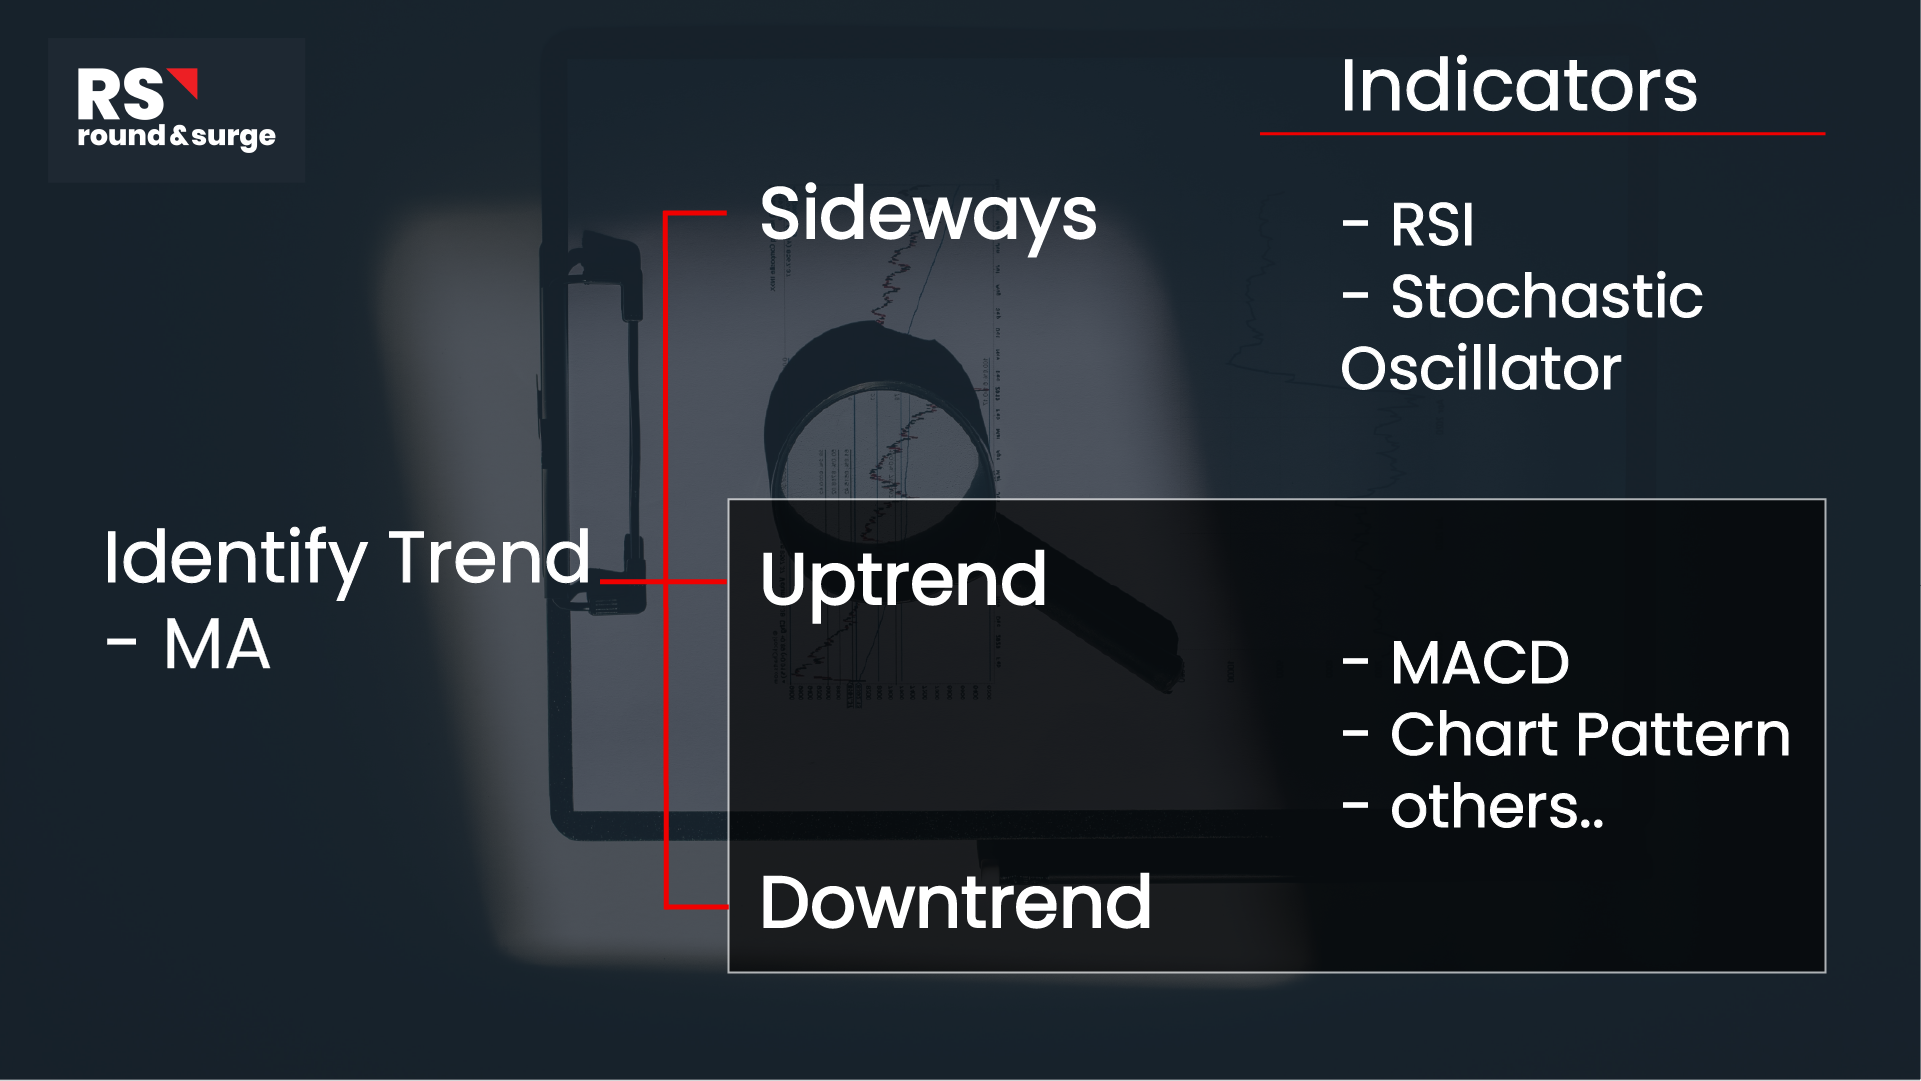
Different indicators are good in different trends, there isn’t 1 indicator that fits all. As an investor or trader, we need to have mental sharpness to identify the changes in trends and know when to apply the right indicators.
Indicators are the easiest tools for investors & traders to identify all of the changes in the market. But as we have mentioned earlier, these indicators are still often lagging in their nature compared to analysing the price & volume directly.
Below are the basic steps as an example to show how & when to apply the right indicators in the right trend.
Steps to apply indicators:
1) Identifying the current trend from Lagging Indicators
2) select the Indicators that works well for the trend from Leading Indicators
3) Identify possible trend change with Lagging Indicators
For example:
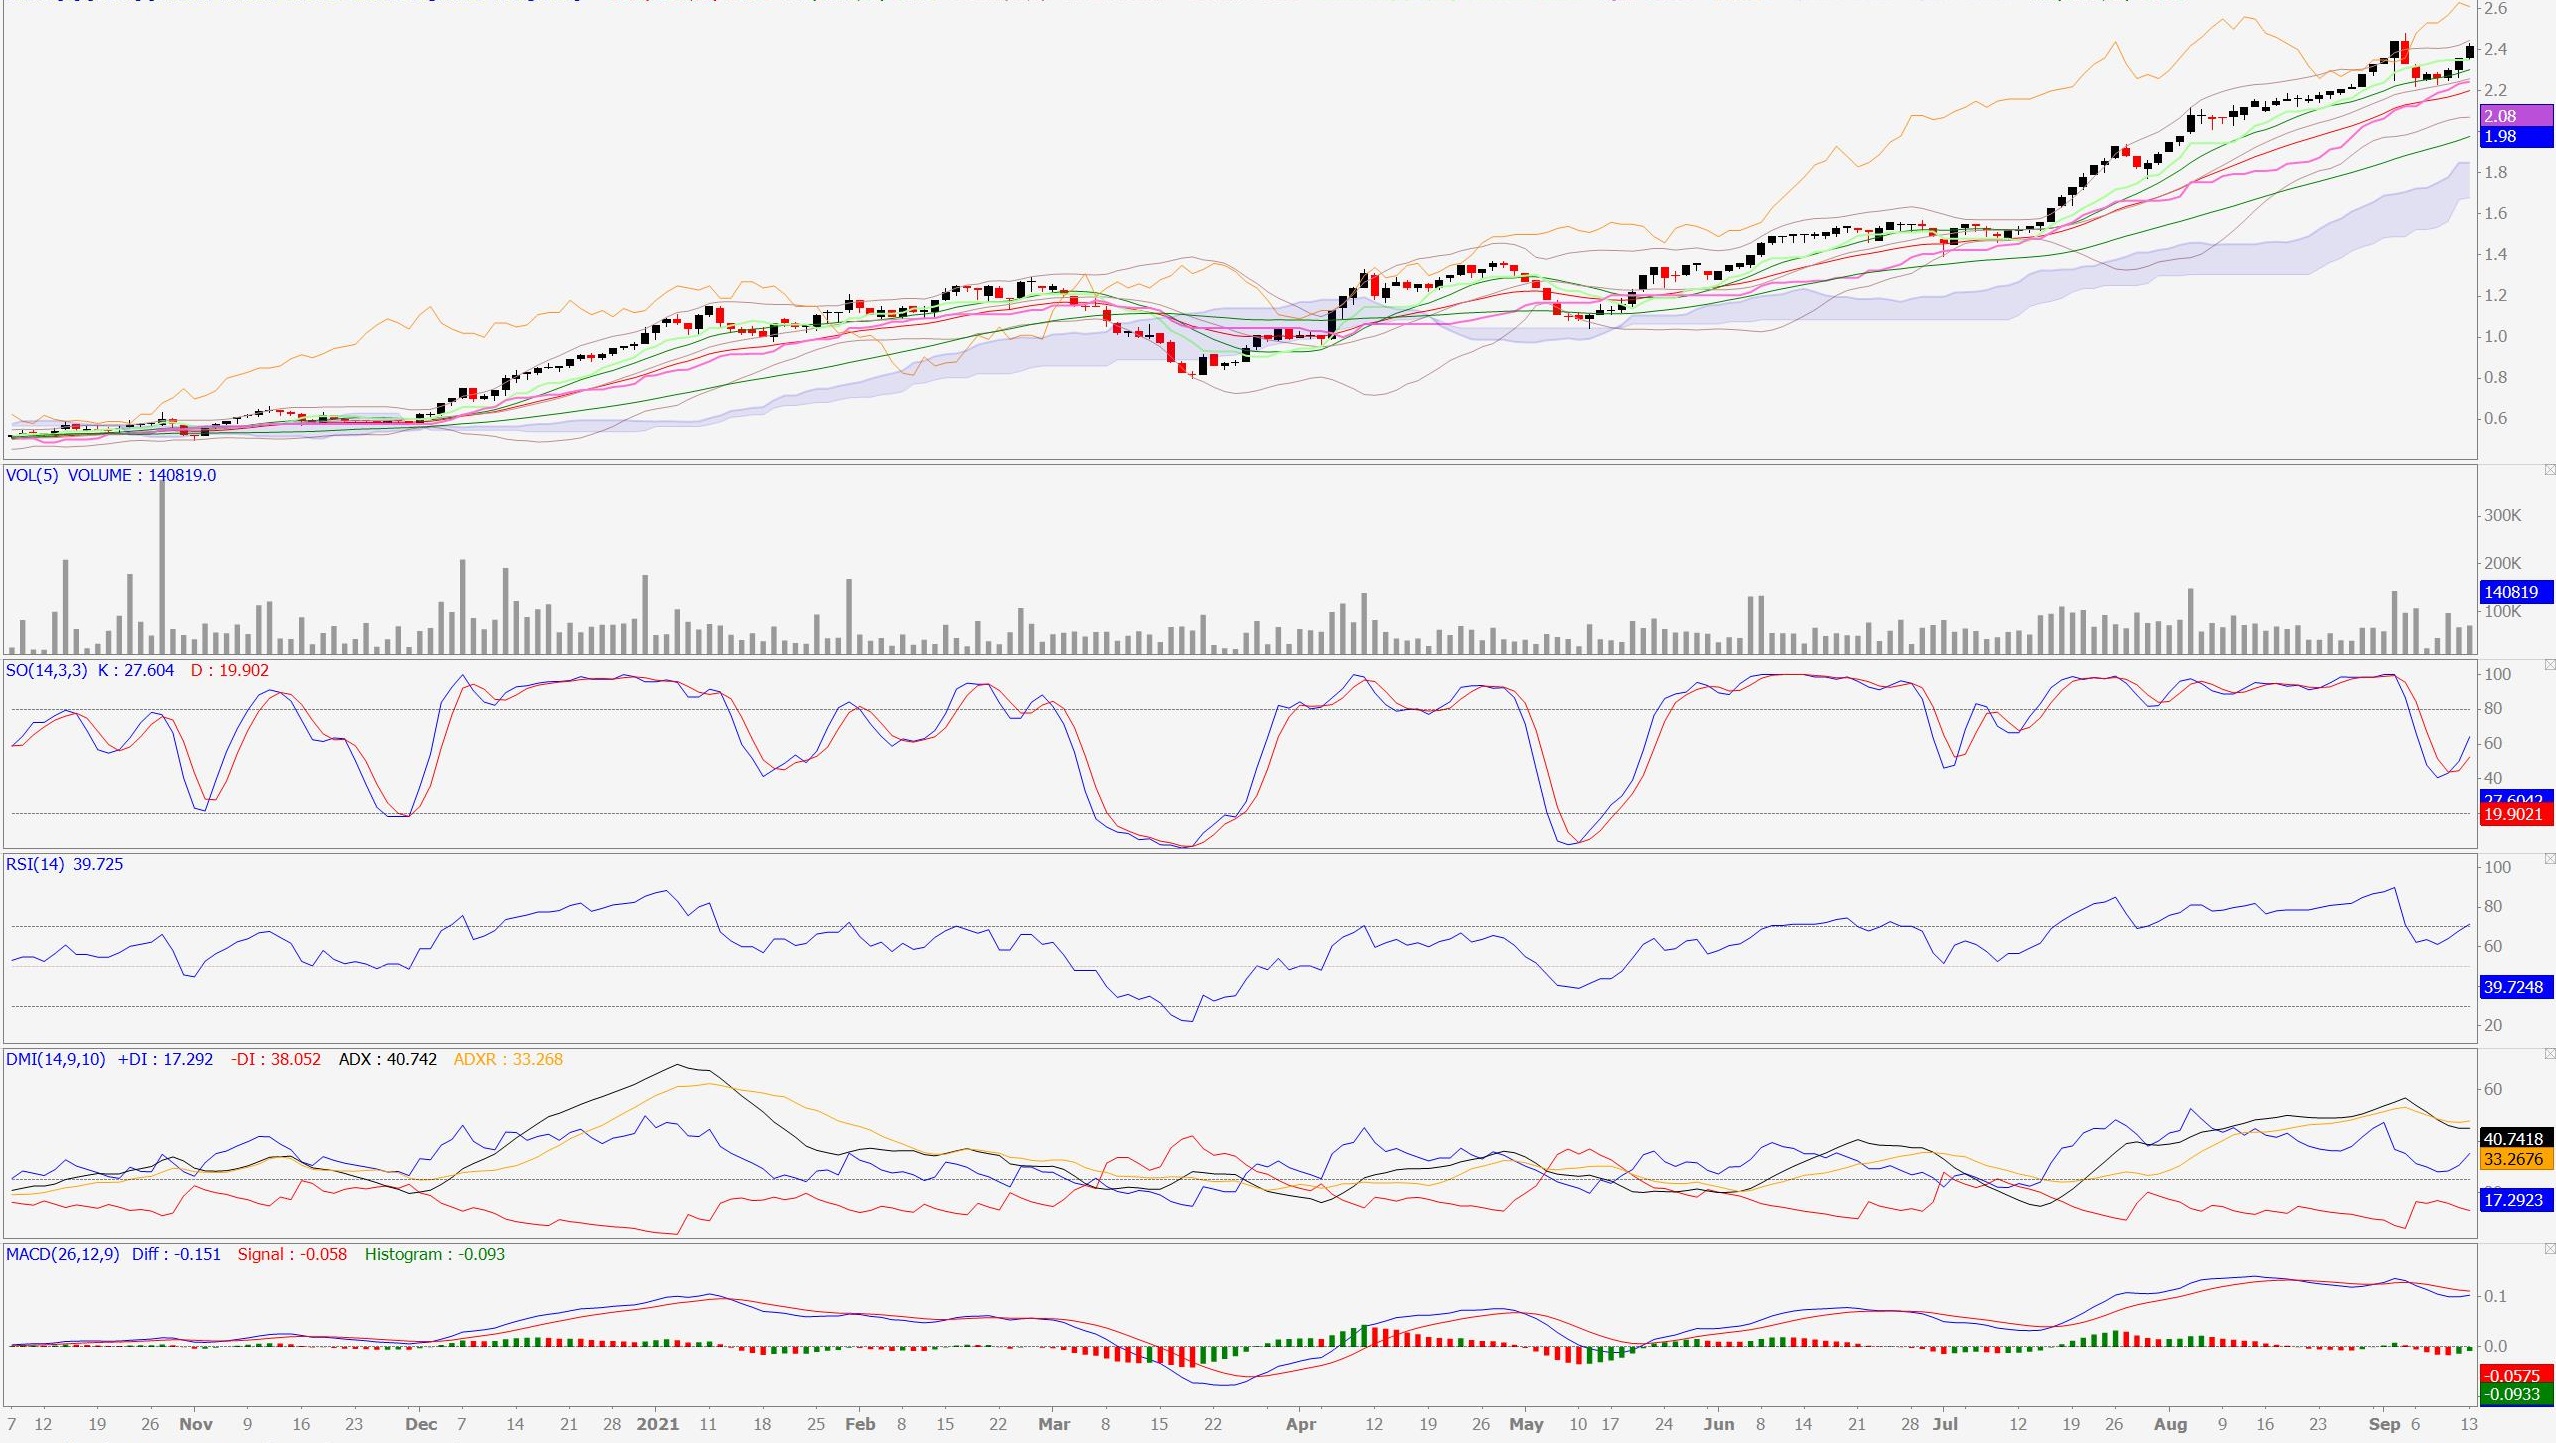
Using Moving Average lines to help in identifying the current trend like the image below.
EMA & short & mid-term MA lines are far apart, showing signs that the stock price is in an uptrend. RSI, Stochastic Oscillators, or any indicators that measure overbought or oversold will not work well in an up-trending or down-trending stock. It is because the indicators will often be “sticky” towards the overbought (uptrend) or oversold (downtrend) area and the price retrace/ rebound from the overbought/ oversold area is not significant. This reduces the effectiveness of the indicators & it is the reason why you always find these indicators sometimes work well, and sometimes are not effective.
When it is an up-trending or down-trending stock, one of the indicators that you may apply to measure the entry & exit timing is MACD (can be applied to sideways trend too). Because the MACD formula is based on the changes between closing prices of x number of days. This formula is close to our Operator Analysis principle on big boys attracting buyers for profit-taking on the way up or down. Big boys sell their shares on the way up, therefore, they will need to attract enough buyers, while not creating a too steep drop in price that will create fear to the retail investors. In order to do so, the big boys will need to control the closing price when they find not many retail investors are queuing their orders at a lower price. Then, they will mark up the price higher to attract more investors for profit-taking.
Find out more about big boys' operation here:
https://youtu.be/mE6RDUrHU6I
https://youtu.be/mE6RDUrHU6I
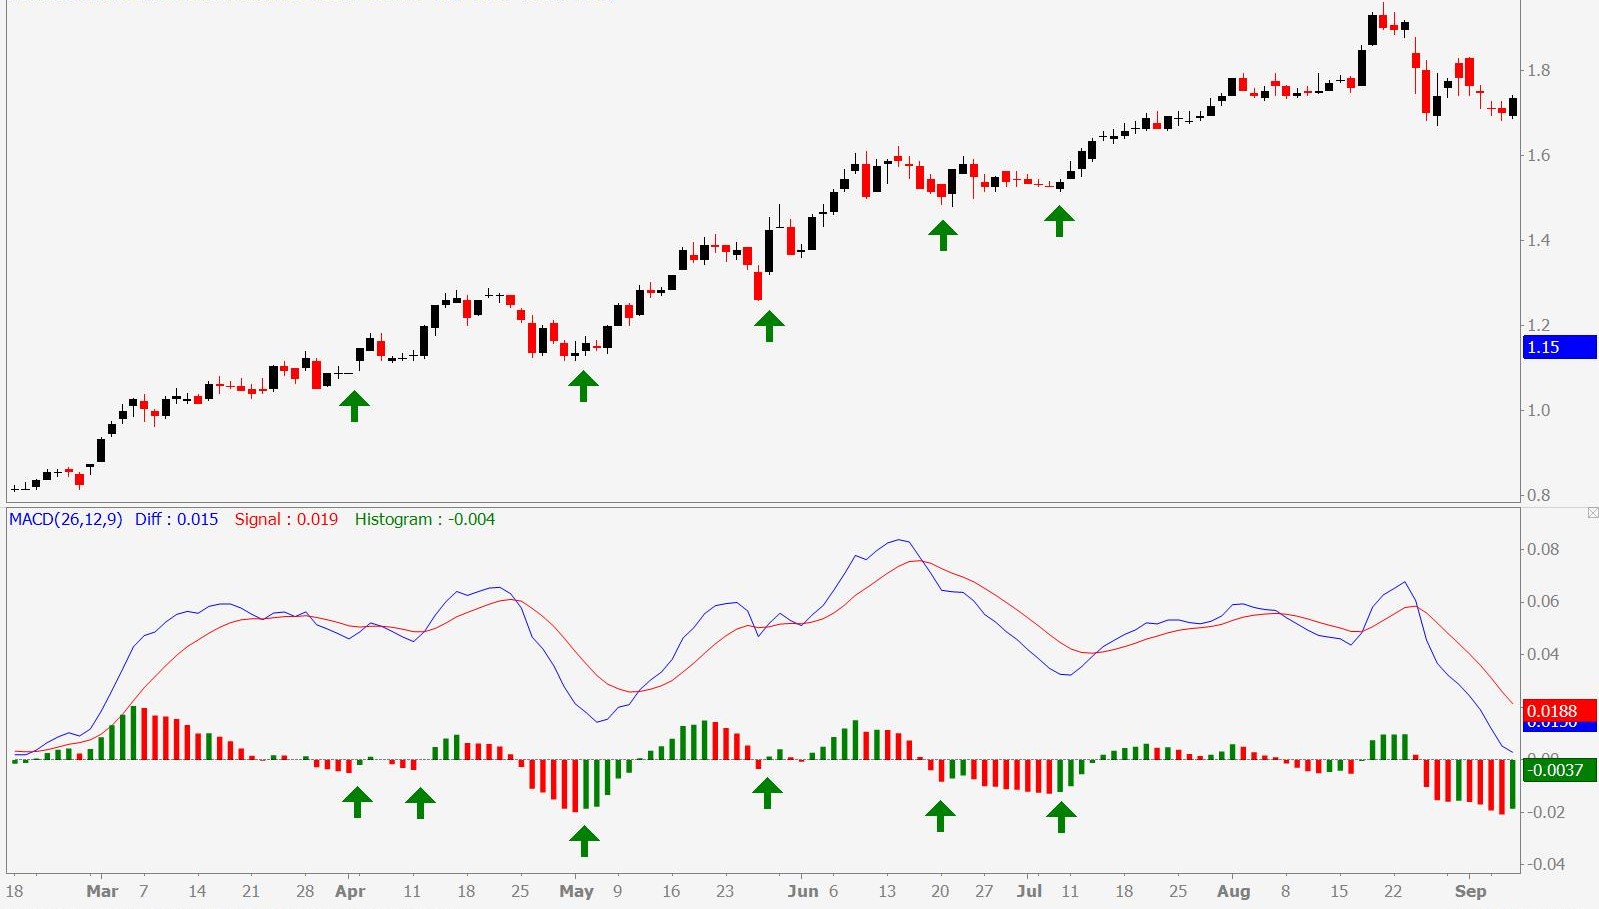
We will analyze the MACD histogram to find the changes in closing price that start to get narrow (green bar) in the negative zone (to identify rebound).
However, based on our observation, the retrace signal in MACD is still 1 to 2 days lagging compared to the price & volume signal. This will affect the late measurement for the exit, which could cause lower profits or breakeven in gross. Because the MACD histogram becomes shorter than yesterday at the positive zone when the price closes lower, which will cause investors & traders to miss out on some profit.
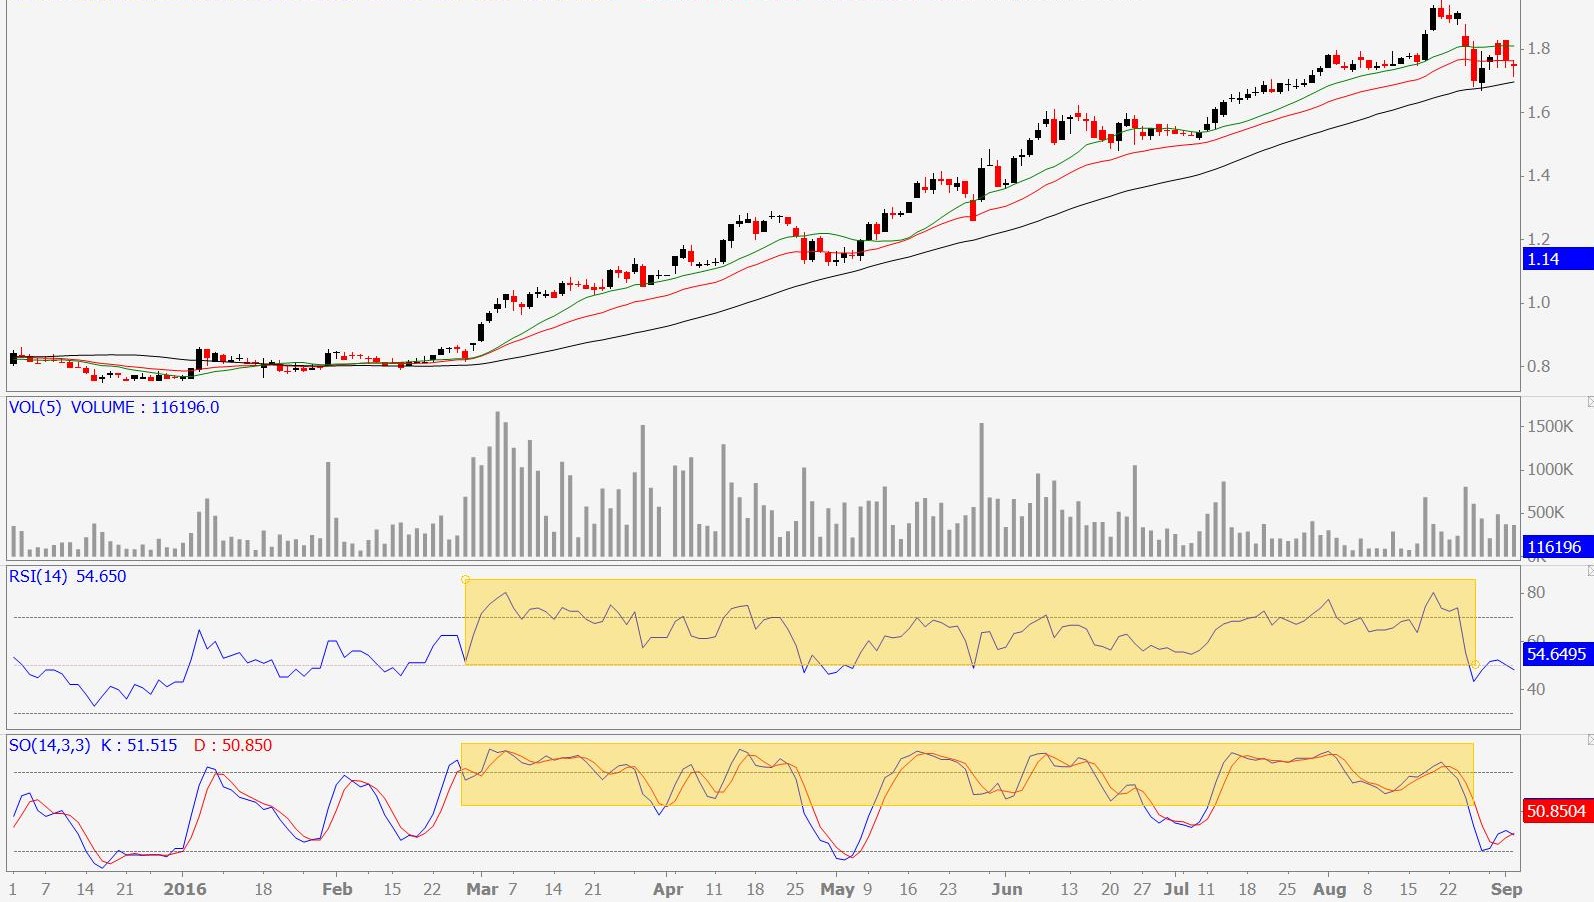
Sideways trending
EMA, short and mid-term MA lines are squeezing together showing signs that the stock price is moving into a sideways trend. This is when we can apply Relative Strength indicators like Stochastic Oscillator. You will notice that the price fluctuation is higher for traders to go in & out within the sideways by following the overbought/ oversold indicator. Price fluctuation is important for traders & investors, especially for those who use traditional technical analysis and indicators. Because the signal for entry and exit are often lagged. Therefore, you will need to have higher volatility in price in order to capture the profit. Otherwise, if you know how to analyze the big boys' intentions with transaction data, you can still make small profits from a small price fluctuation. Because the entry/ exit is often lower/ higher than the lagging traditional analysis.
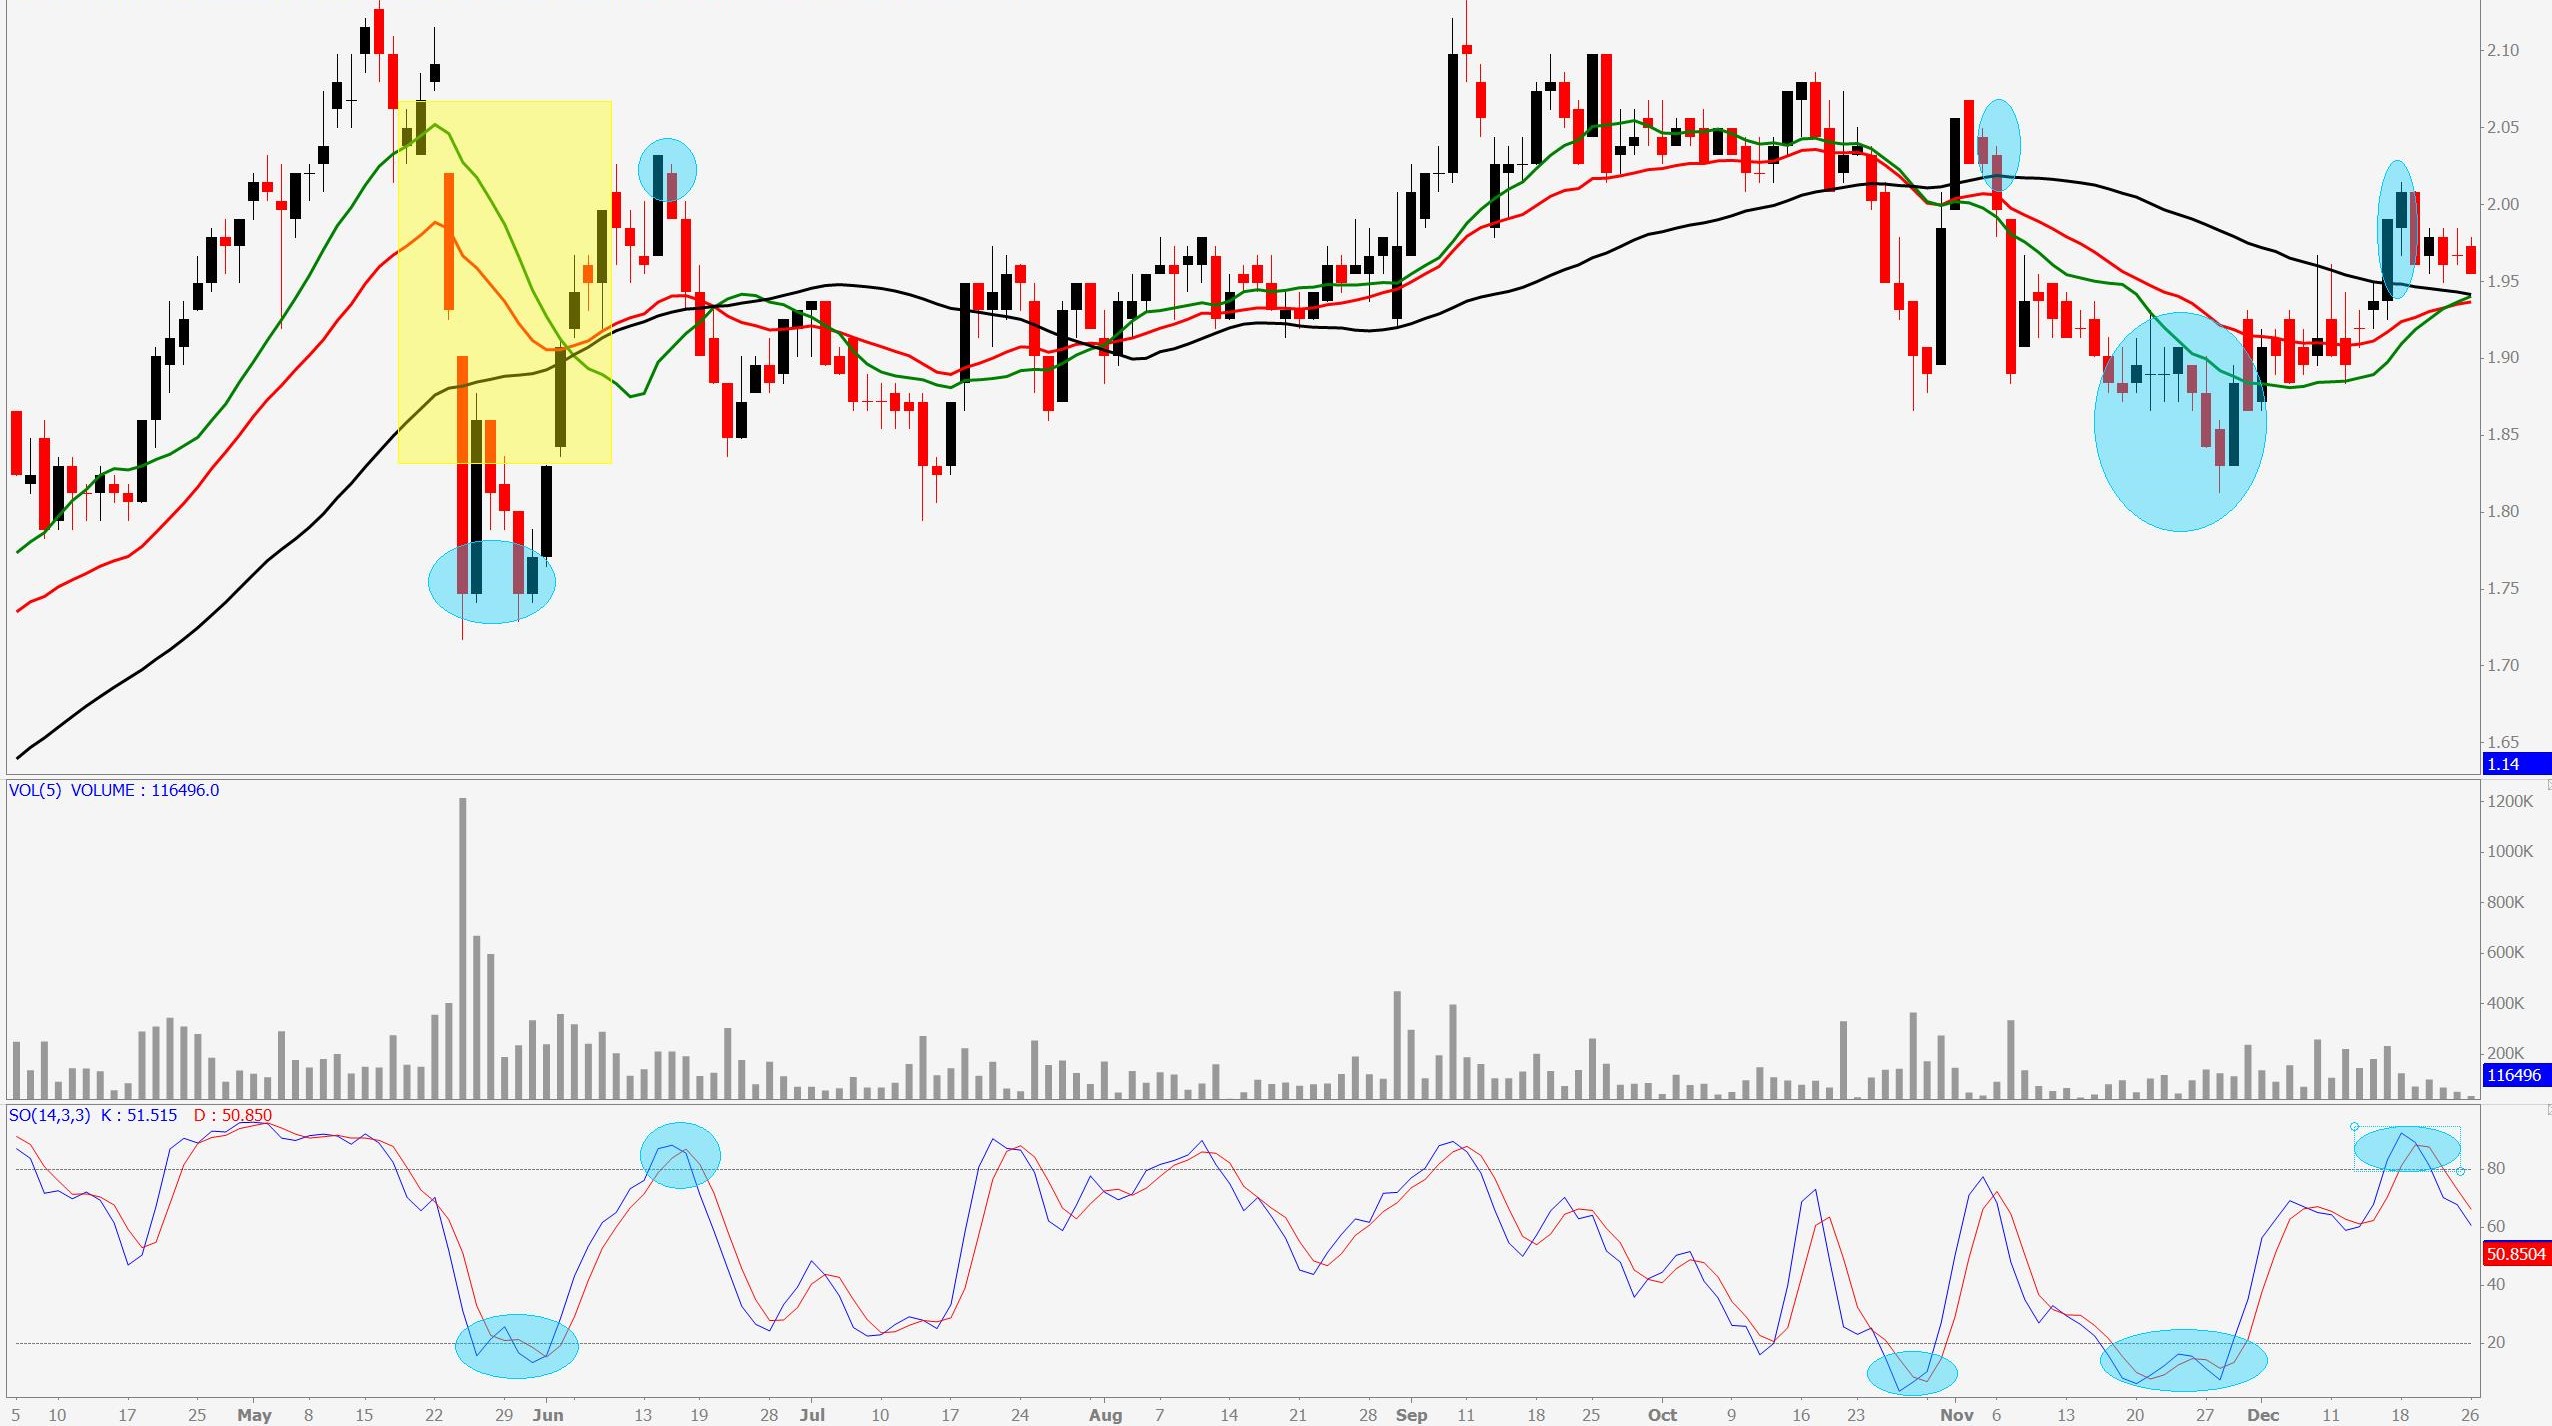
From the chart above, Stochastic oversold & overbought provide better measurement on the short term price reversal than the stock is up or down trending.
Lastly
A gentle reminder, whether it is a Leading type or Lagging type indicator, it is still lagging compared to direct analysis from price & volume. Because these indicator formulas are based on the price & volume too. But because the formula is to smoothen the price for investors to analyze for particular purposes, therefore, it doesn’t tell the whole story of the big boys' intention.
If you want to achieve more in trading or investing, we will recommend you to look into understanding how big boys operate. It will definitely be better than indicators or traditional technical analysis.
Operator Analysis Vs Traditional Analysis : https://youtu.be/hYzLUGGjVto
But if you are a fan of indicators or you just want an “easy-entry” to trade or find the right point for your investment. Then do remember the 3 steps below when you are choosing which indicators for your analysis.
Step 1: Identify the indicator type [ Leading or Lagging]
Step 2: Apply the indicator that helps you to identify trend
Step 3: Select the right indicator for the trend.
Step 4: Watch any possible changes in trend and react accordingly.
Step 5: REPEAT.
Gentle reminder again, you don’t need many indicators for your analysis. 1 or 2 will be sufficient IF you understand the functions of these indicators.
Hope this blog will help you to understand better in indicators application. If you find it helpful to you, please give us a like and help us to share this out with more traders & investors.
Understanding big boys : https://bit.ly/roundnsurge
Website : www.roundnsurge.com
Facebook: www.facebook.com/roundnsurgeofficial
Youtube: www.youtube.com/c/RoundSurgeoperatoranalysis
Instagram: @roundnsurge
Kelvin's Instagram: @kelvinnny810
Malaysia stock market is a unique market, hence it requires a customized trading approach to tackle & swerve. Many existing traders in Malaysia apply a plug-and-play strategy from the overseas stock market, but it is not necessarily the best strategy to trade in KLSE. This is due to the difference in local and overseas stock market regulation and the size of market participants of institutional funds & retail investors.
“True traders react to the market.” is the backbone of our trading method. Our findings and strategies are developed through years of trading experience and observance of the operating style in Malaysia’s stock market.
Trading Account Opening
They are offering an IntraDay trade brokerage rate at 0.05% or RM8 whichever is higher for day trading stocks RM 50,000 & above-transacted volume (buy sell the same stocks on the same day). Buy & hold at 0.08%or RM8 whichever is higher.
Open a cash account now at the link below :
https://registration.mplusonline.com/?ref-id=R311
As Kelvin’s trading client, you will be exclusively invited to join Kelvin’s weekly webinar and telegram group. Click here to join.
For more inquiry contact him by email: kelvinyap.remisier@gmail.com or 019-5567829
If we have missed out on any important information, feel free to let us know and feel free to share this information out but it will be much appreciated if you can put us as the reference for our effort and respect, thank you in advance!
This blog is for sharing our point of view about the market movement and stocks only. The opinions and information herein are based on available data believed to be reliable and shall not be construed as an offer, invitation or solicitation to buy or sell any securities. Round & Surge and/or its associated persons do not warrant, represent, and/or guarantee the accuracy of any opinions and information herein in any manner whatsoever. No reliance upon any parts thereof by anyone shall give rise to any claim whatsoever against Round & Surge. It is not advice or recommendation to buy or sell any financial instrument. Viewers and readers are responsible for your own trading decision. The author of this blog is not liable for any losses incurred from any investment or trading.
More articles on Round & Surge Operator Analysis
Understanding Support and Resistance through Big Boys Demand and Supply
Created by roundnsurge | Aug 09, 2023
"Master Support & Resistance: Trade Hang Seng with Big Player Insights. Learn to spot levels using price & volume analysis. Trade smarter, minimize risks. Watch YouTube for examples.
Maximize day trading potential returns 10%-50% a day [ Hang Seng Index : CBBC VS. STRUCTURED WARRANTS ]
Created by roundnsurge | Jun 27, 2023
Discover the differences between Callable Bull/Bear Contracts (CBBCs) and structured warrants on the Hang Seng Index (HSI) to maximize your day trading returns.
Why Traders Are Switching to CBBCs from Stocks, CFD Forex, Cryptocurrency, and Futures Contracts
Created by roundnsurge | May 22, 2023
Discover the incredible profit potential of Callable Bull/Bear Contracts (CBBC). The ability to profit in rising and falling markets, and lower entry barriers make CBBC the superior choice for trader.
The Shortcut to Success: Short-Term Trading Strategies for KLSE and SGX
Created by roundnsurge | Apr 17, 2023
Identify profitable rebound stocks by following big players' support during downtrends & retracement understanding their marking of price levels in this short-term trading strategy for KLSE & SGX.

Boost Your Income With Trading: Building for the Future vs. Living for the Now
Created by roundnsurge | Apr 05, 2023
Unlock your financial potential with investment and trading strategies for building current and future income.

From Losses to Consistent Profits: An Insider's Guide to Overcoming Trading Experience in the Stock Market
Created by roundnsurge | Feb 04, 2023
Being able to accept our losses is the first step in being able to learn from them and turn that into future profit!
KLSE Day Trading | How to read big boys transaction to make profit | R&S Training class [Cut Scene]
Created by roundnsurge | Jan 29, 2023
We're going to give you an insider's look at how the big boys get their info and make trades, so that you can do it too!

Trading Technique To Find Best Entry & Exit for 2023 Top Stocks
Created by roundnsurge | Jan 12, 2023
We can’t avoid big boys in the stock market, so we learn how they operate & take advantage of their price movement for our better entry & exit.
Discussions
Be the first to like this. Showing 0 of 0 comments
Post a Comment
Featured Posts
Introducing MY's First IPO Fund for Sophisticated Investors!
New Update. Discover investment communities that resonate with your ideas
M & A Value Partners IPO Equity Fund has been launched - Targeted 13% Return p.a
Latest Videos

.png)


Apps


Top Articles
1
Mercury Securities Research
3
4
BFM Podcast
5
save malaysia!
7
BFM Podcast
8
BFM Podcast
#
Stock
Score
Daily Stocks
Stock Name
Last
Change
Volume
Stock Name
Last
Change
Volume
Stock Name
Last
Change
Volume
MQ Trading Signals
Stock
Time
Signal
Duration
No trading signals available.
Stock
Time
Signal
Duration
No trading signals available.
Featured Advertisers / Partners


Ride The Bull Short The Bear
CS Tan
4.9 / 5.0
This book is the result of the author's many years of experience and observation throughout his 26 years in the stockbroking industry. It was written for general public to learn to invest based on facts and not on fantasies or hearsay....