


TradeVSA - Case Study
Step by Step Guide to Spot Pullback using Volume Spread Analysis

A pullback is a temporary retracement in a stock pricing during mark-up stage / uptrend. Pullbacks are widely seen as buying opportunities after a stock has experienced a large upward price movement. Pullback strategy give us the advantage of buying at a lower price in an uptrend to reduce risk and the opportunity to ride the primary trend to increase profit.
As Volume Spread Analysis trader, we tend to combine Sign of Strength signals into the Pullback setup to ensure we buy at the right price with lower risk. In this article, we will focus Pullback with No Supply signal.
No Supply (NS) signal simply mean lack of sellers at the particular price range. No Supply signal can be spotted mostly in a support level. Once No Supply signal appeared, these indicating sellers have been removed from the market and Smart Money ready to mark the price higher!
Below are the case study and recent pullback setup with No Supply signal
Case Study 1
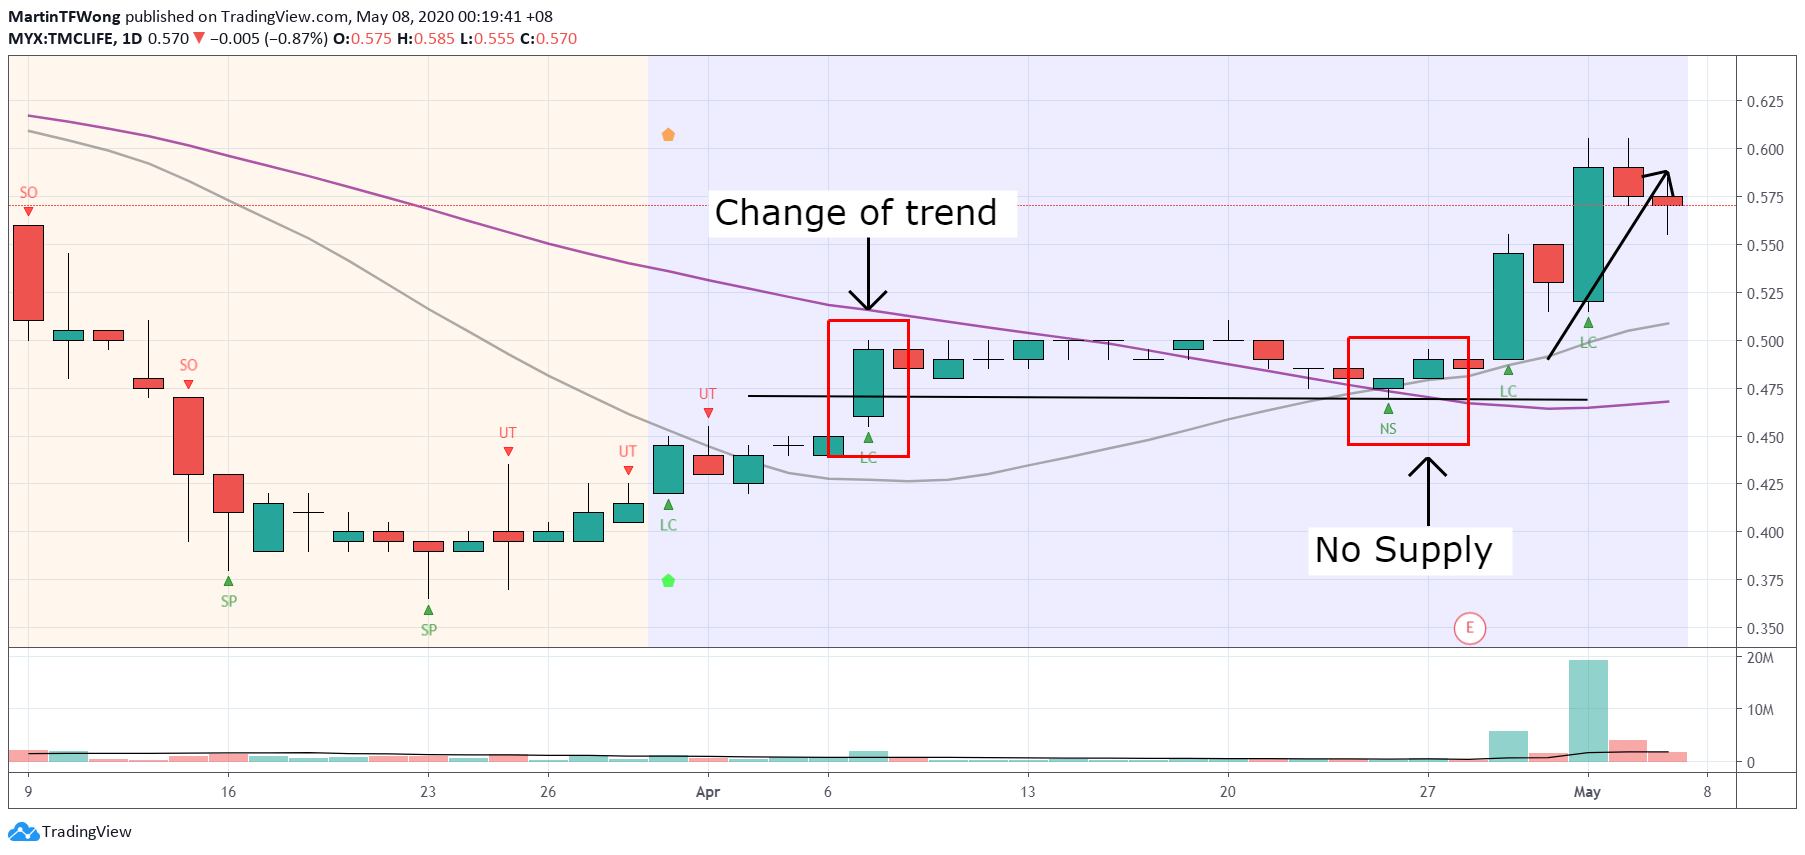
Signal in the daily chart above:
- Change in trend with Line Change (LC)
- Price pullback
- No Supply indicate no sellers before Smart Money mark the price up
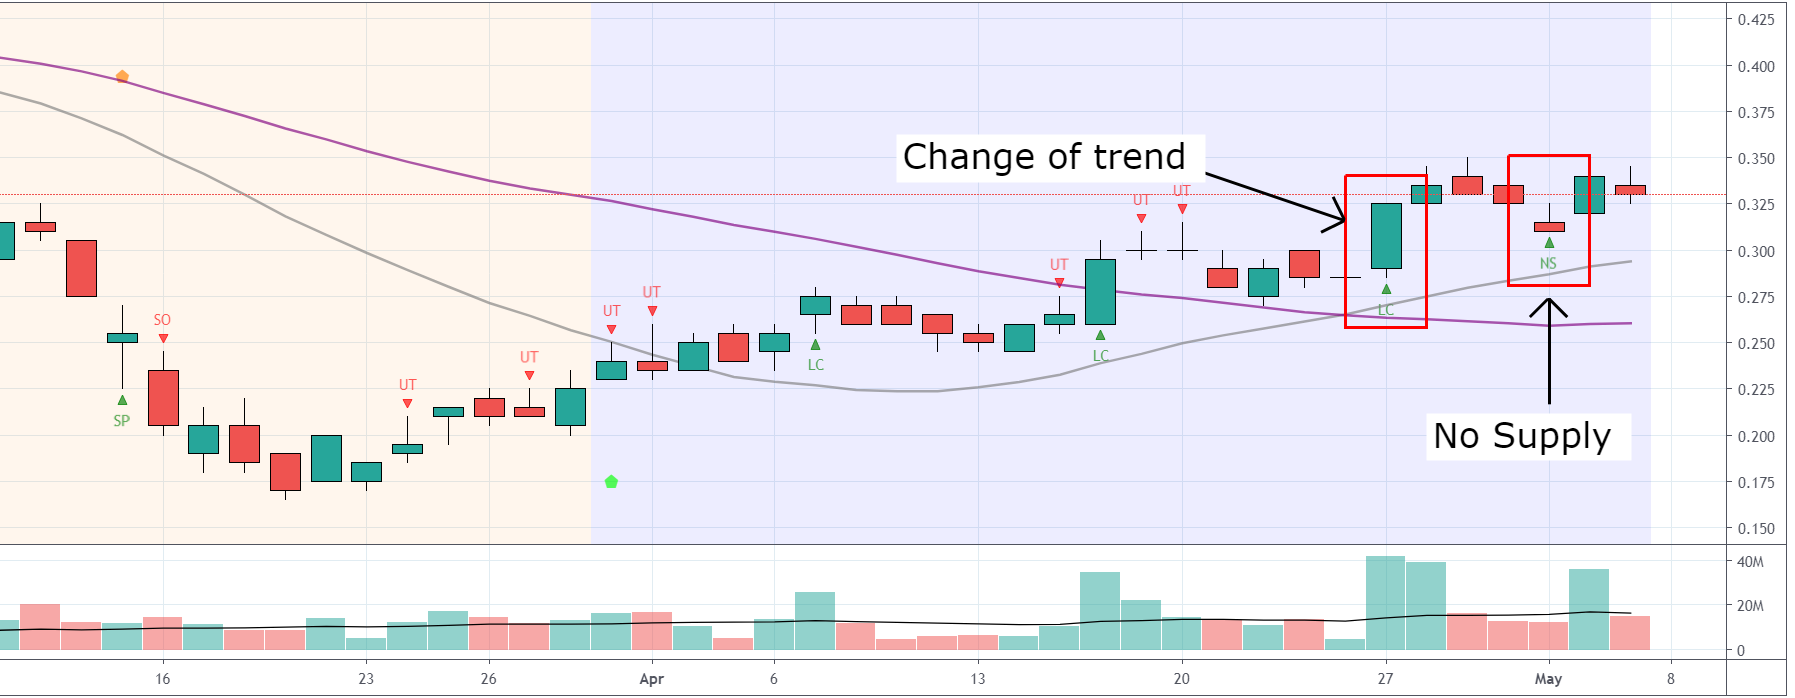
Case Study 2
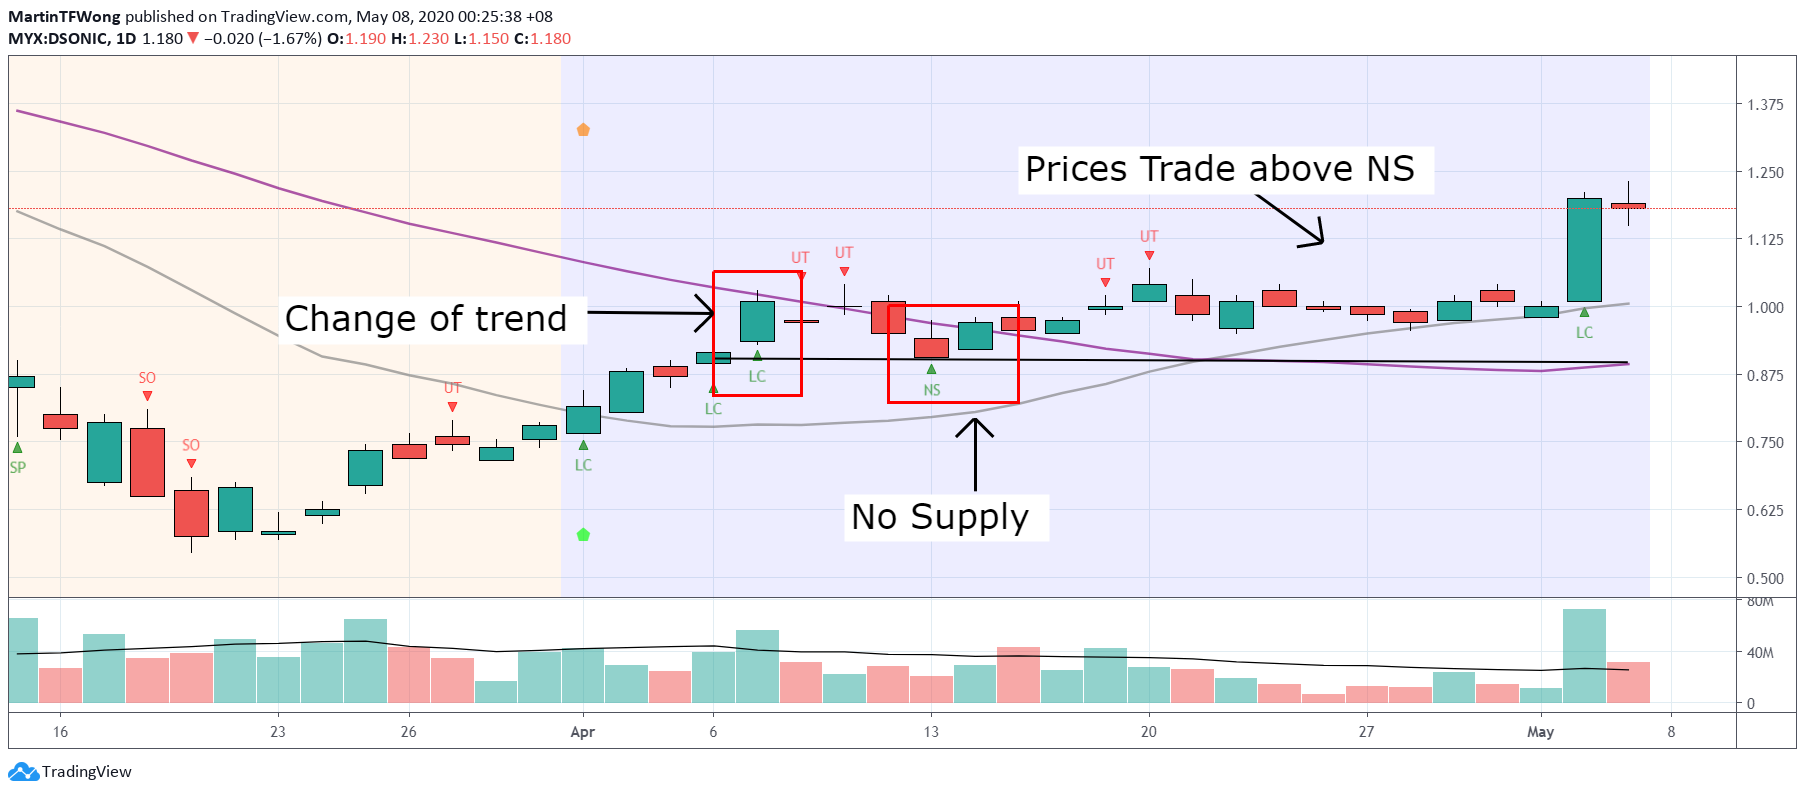
Signal in the daily chart:
- Line Change with change of trend
- No Supply signal marked the lowest in the new support level
- Prices trading above NS signal indicate strong support from Smart Money
Case Study 3
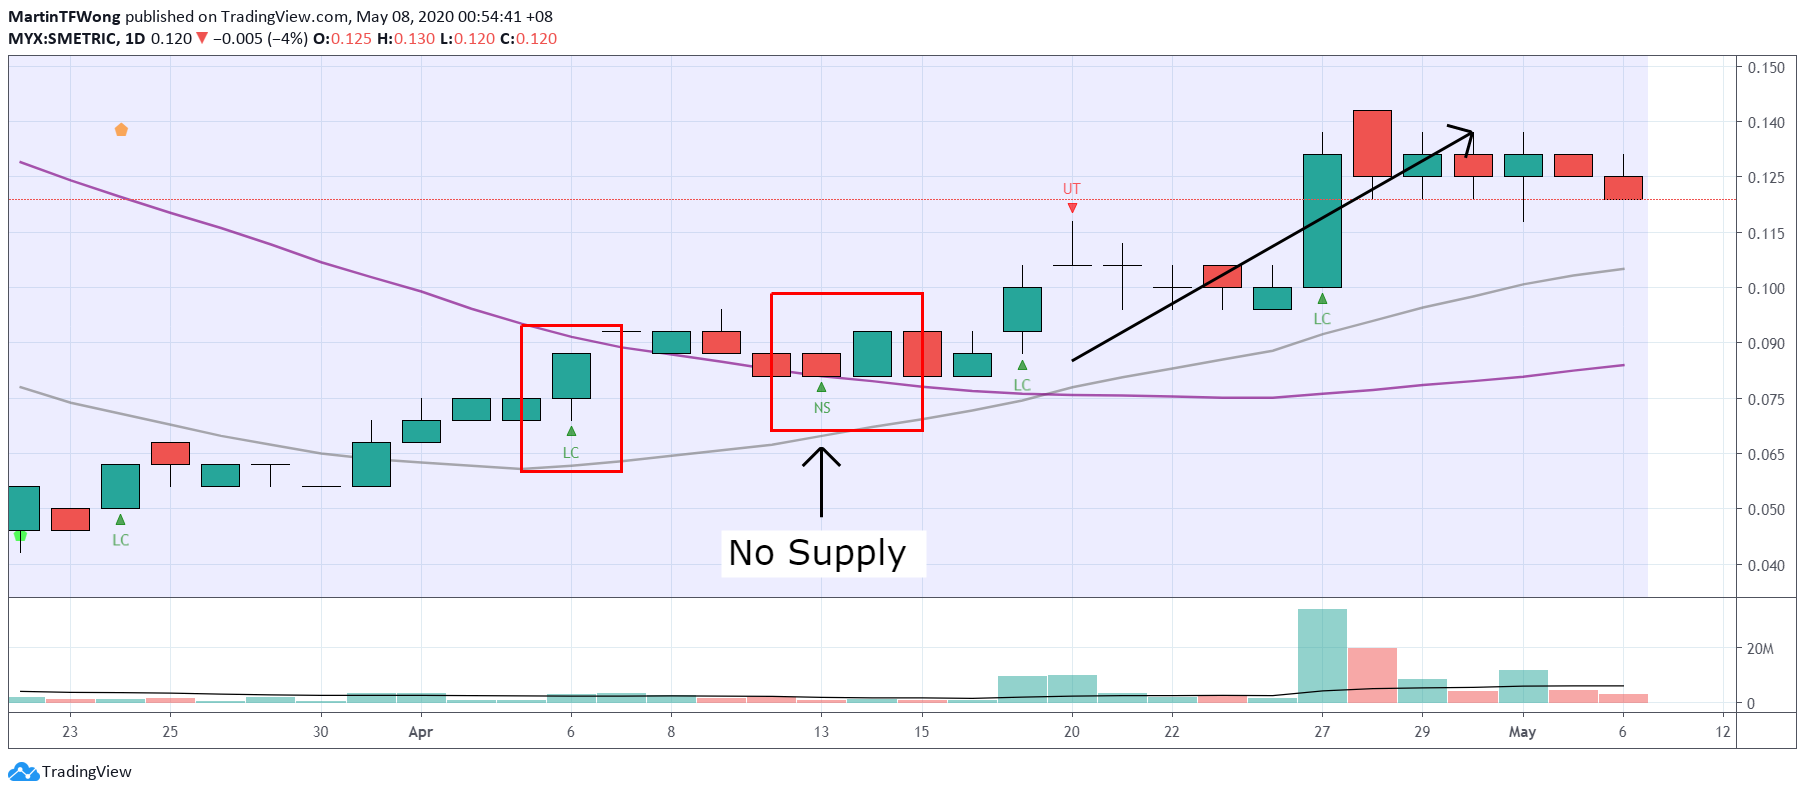 Signal in the daily chart:
- No Supply marked the lowest of new support
- Continuation of Mark-Up after Pullback
- Lack of sellers detected by Smart Money
Current Pullback Setup 1
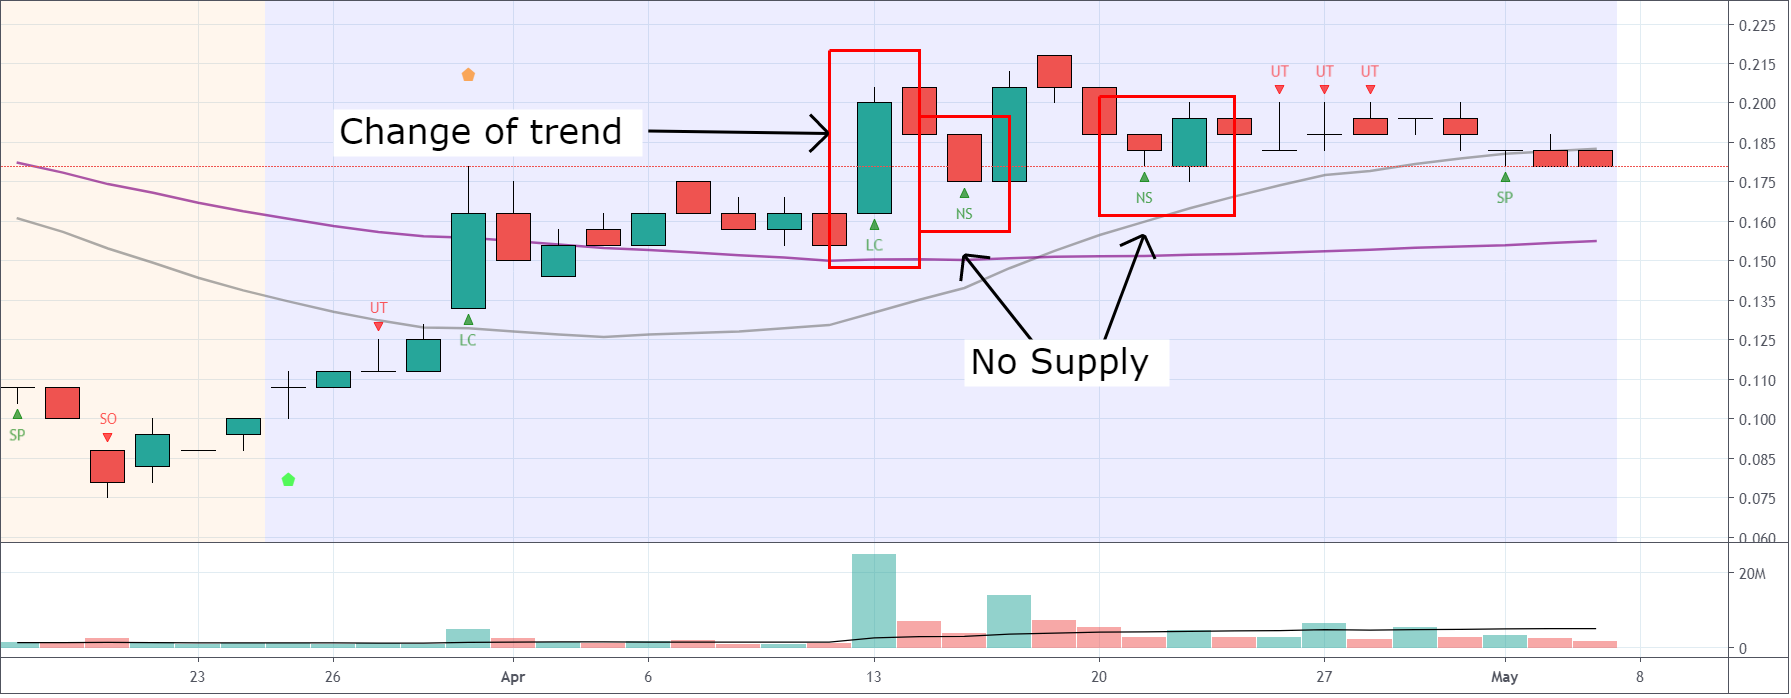
Strength signal in the chart:
- Line Change high volume
- Price pullback with No Supply signal
- Prices trading above / near No Supply signal
Current Pullback Setup 2
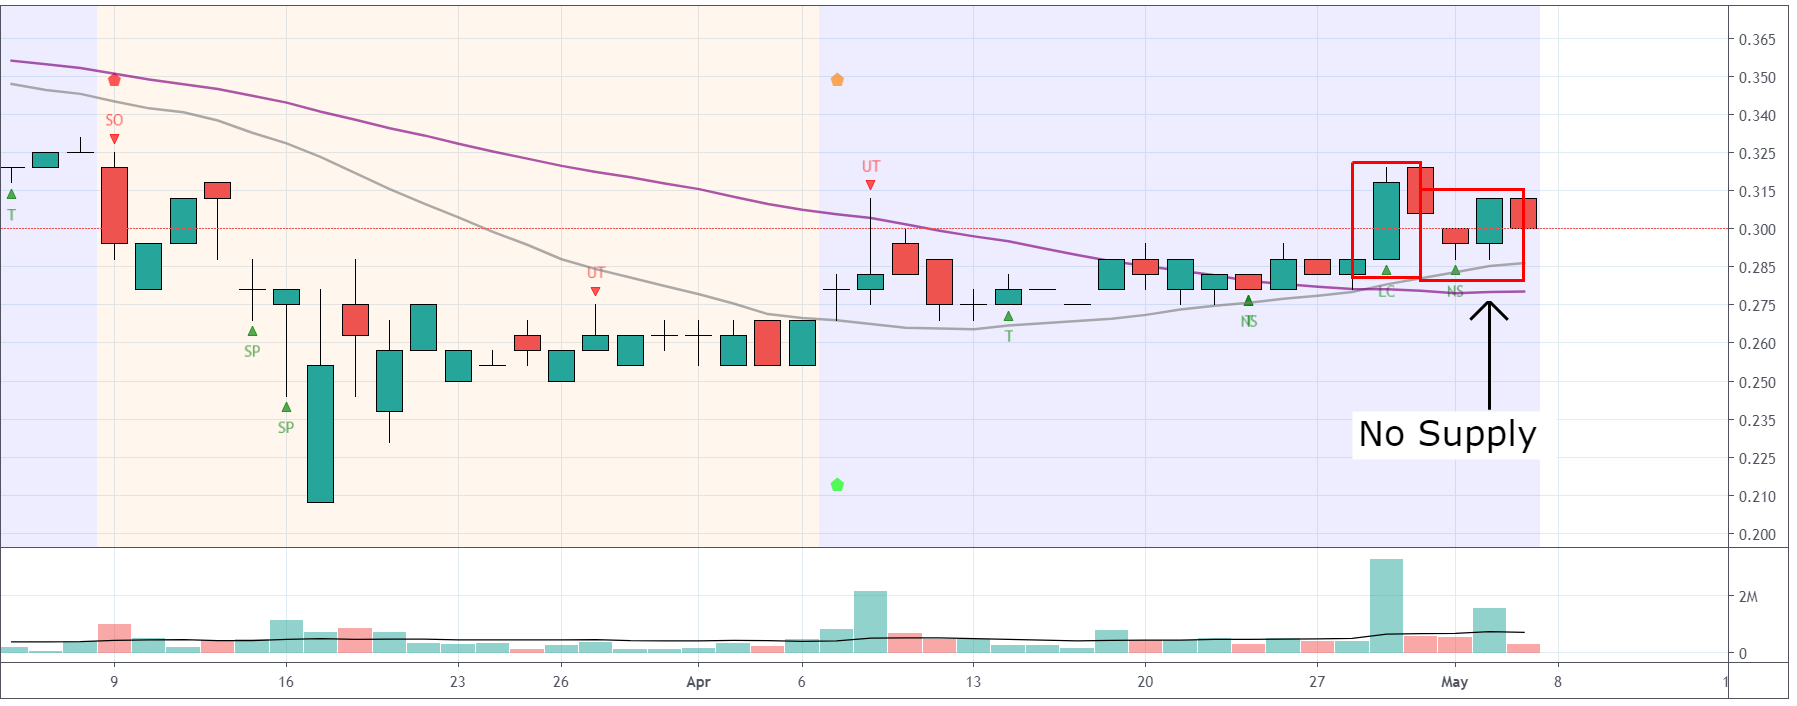
Strength in the chart:
- High volume Line Change
- Price tested Line Change with No Supply signal
Current Pullback Setup 3
Strength in the chart:
- Price continue to mark-up with Line Change
- No Supply marked the complete of the pullback
- Price trading above No Supply
All example above shown how can a Volume Spread Analysis trader improve his entry during pullback using COMBO Setup (Green Pentagon + Line Change + No Supply). Below are the previous pullback review with different Strength setup:
- Sedania – 3 May 2020
https://www.tradingview.com/chart/SEDANIA/EGGKUyJO-TradeVSA-Pullback-Completed-with-Spring-Sedania/
- Elsoft, DUFU, Supermax – 1 May 2020
https://www.tradingview.com/chart/SUPERMX/ylnDrbo4-TradeVSA-The-Best-Risk-to-Reward-Trade-Setup/
- Damansara Realty BHD – 19 April 2020
https://www.tradingview.com/chart/DBHD/37ZIq478-TradeVSA-DBHD-Pullback-Completed/
Contact us via: email at support@tradevsa.com or Call/WhatsApp at +6010 266 9761 if you have any queries.
Join our FREE Education via Telegram Channel: https://t.me/tradevsatradingideas
Facebook: www.facebook.com/MartinTFWong
Youtube: https://www.youtube.com/channel/UCKiafbxoa-DtTF5YP0v-HYg
Follow in the Telegram, Facebook and Youtube for daily update
More articles on TradeVSA - Case Study
Chinese Internet Stock (HKSE) Crackdown – Is it an opportunity for investors?
Created by TradeVSA | Nov 01, 2021
3 Revenue Stream You Must Look into KLSE Energy Sector Before You Buy!
Created by TradeVSA | Oct 15, 2021
AirAsia – Is this a time to look into AirAsia for Economy Reopening & its new business development ?
Created by TradeVSA | Oct 06, 2021
Featured Posts


Apps


Top Articles
1
https://dividendguy67.blogspot.com
2
3
4
5
7
Kenanga Research & Investment
8
Good Articles to Share
#
Stock
Score
Daily Stocks
Stock Name
Last
Change
Volume
Stock Name
Last
Change
Volume
Stock Name
Last
Change
Volume
MQ Trading Signals
Stock
Time
Signal
Duration
No trading signals available.
Stock
Time
Signal
Duration
No trading signals available.
Featured Advertisers / Partners


Ride The Bull Short The Bear
CS Tan
4.9 / 5.0
This book is the result of the author's many years of experience and observation throughout his 26 years in the stockbroking industry. It was written for general public to learn to invest based on facts and not on fantasies or hearsay....
Taehyung
Look complicated, but useless analysis !
simply can't make money using this type of flipflop trading method !
2020-05-08 08:56