


TradeVSA - Stock Trade Ideas
Carimin (5257.KL) to Form Re-Accumulation with Failed Up-Thrust

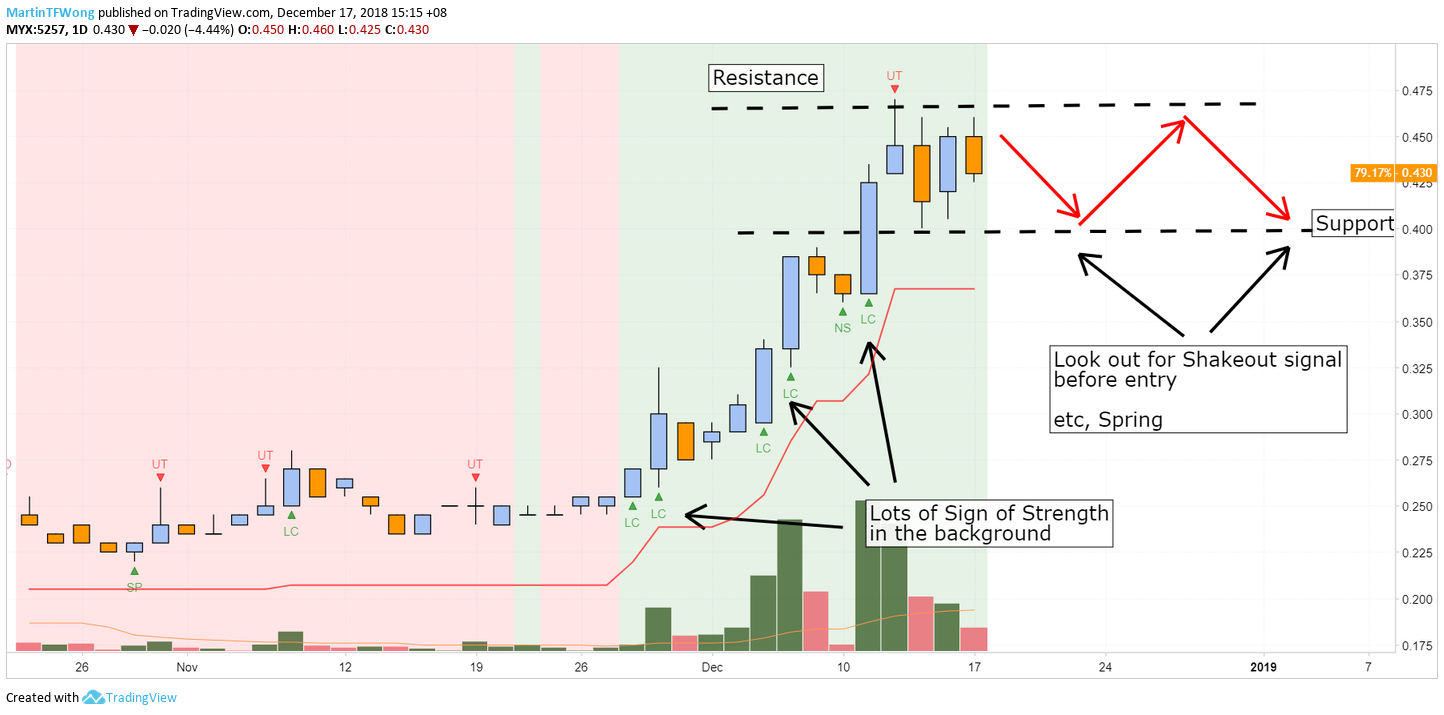
Carimin daily chart shown 1st Sign of Weakness on 12 December 2018 after the breakout (18 Line Change signal) with +43% gained. We are expecting the stock to reverse after the Up-Thrust with high volume. The subsequent bars didn’t close lower and forming a narrow spread with low volume. Narrow spread bars with low volume is a sign of strength according to Volume Spread Analysis.
Based on the current chart pattern, we notice Carimin is forming a re-accumulation stage. Smart Money tend to test potential seller or supply in this period. We’re expecting the price for Carimin to move sideways and form a shakeout bar (Spring) at the support level.
Send us your preference stock to review based on TradeVSA chart by comment at below.
Interested to learn more?
· FREE Workshop, 29 December (Sun), 2pm: https://bit.ly/2rsig9p
· Visit our website for FREE Stock Screener: https://tradevsa.com/
· Contact us via: email at support@tradevsa.com or Call/WhatsApp at +6010 266 9761
Disclaimer
This information only serves as reference information and does not constitute a buy or sell call. Conduct your own research and assessment before deciding to buy or sell any stock
Related Stocks
| Chart | Stock Name | Last | Change | Volume |
|---|
More articles on TradeVSA - Stock Trade Ideas
Discussions
Be the first to like this. Showing 0 of 0 comments
Post a Comment
Featured Posts


Apps


Top Articles
1
https://dividendguy67.blogspot.com
3
4
Good Articles to Share
Could Kamala Harris beat Donald Trump in November's presidential race?
5
Good Articles to Share
6
Good Articles to Share
Iranian warship capsizes during repairs in port of Bandar Abbas
7
Good Articles to Share
Why Impossible Foods signed hot dog-eating legend Joey Chestnut #yahoofinance #youtubeshorts
8
Good Articles to Share
Jonathan Turley unveils exciting new book 'Free Speech in the Age of Rage'
#
Stock
Score
Daily Stocks
Stock Name
Last
Change
Volume
Stock Name
Last
Change
Volume
Stock Name
Last
Change
Volume
Featured Advertisers / Partners


Ride The Bull Short The Bear
CS Tan
4.9 / 5.0
This book is the result of the author's many years of experience and observation throughout his 26 years in the stockbroking industry. It was written for general public to learn to invest based on facts and not on fantasies or hearsay....